Scientists Visualize the Sun's Mysteries Using 400 Years of Solar Observations
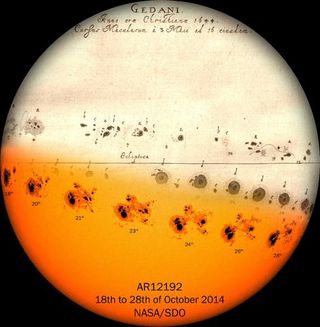
In an effort to better grasp the sun's past, present and future, Colombian and Spanish researchers made visualizations that meld the last 400 years of recorded solar observations.
The sun is a churning celestial body with a lot going on. On top of singular episodes like flares, the sun experiences various cycles that last years, decades and longer. And these chapters in solar activity are full of lulls and highs that affect Earth in many ways.
"It's a matter of representing the historical data so that people can easily make a judgment where it can be trusted, where you can make strong assertions, and where you have to be cautious about making strong statements," Andrés Muñoz-Jaramillo, lead author on the new work and a researcher at the Southwest Research Institute in San Antonio, told Space.com. He and colleague José Manuel Vaquero of the University of Extremadura in Spain recently published a series of visualizations to develop a truer sense of solar activity and to highlight gaps in solar knowledge. [How a 19th-Century Teenage Astronomer Documented a Rare Solar Flare]
The sun's impact
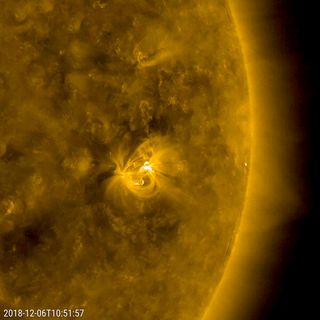
This week, data from the spacecraft Voyager 2 confirmed its exit from the heliosphere, the sphere of influence of the sun's radiation surrounding the solar system. The heliosphere is made up of the sun's magnetic field and the particles it has charged, and it protects the planets within it from incoming cosmic radiation.
The sun's regular, roughly 11-year cycle leaves an impact on the bodies within its sphere of influence, according to the new study.
During the cycle's quiet period, known as solar minimum, Earth's outermost atmospheric layer can shrink. This, in turn, can cause a lingering of space junk that poses a threat to orbiting spacecraft. And during the sun's opposite season, called solar maximum, sunspots and flares increase in number, producing powerful solar storms that can disrupt communications systems and even cause a blackout.
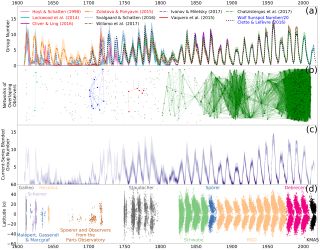
"The sun has seasons like Earth in some sense, where you have periods of a lot of activity and periods of very little activity… we call that space climate," Muñoz-Jaramillo said.
Get the Space.com Newsletter
Breaking space news, the latest updates on rocket launches, skywatching events and more!
Muñoz-Jaramillo used earthly weather events, seasons and oscillations like El Niño in his description of solar activity.
Singular events, like flares, are referred to as space weather. A period like the solar minimum is comparable to a solar dry season, and the decadal solar cycles as a whole, which do overlap with one another and can change slightly in duration, are something like the longer-term El Niño Southern Oscillation cycles over the Pacific Ocean. [NASA's Sun-Kissing Solar Probe Survives 1st Flyby of Our Star]
Watching the sun
Observing the sun is an ancient human practice; the creation of deities like the sun god Ra from Egypt and the sun goddess Saulė from the Baltics are early examples of societies' interest. People still observe holidays like Christmas (Dec. 25) and Inti Raymi (Jun. 24), which occur near the winter solstice to celebrate the start of a new year (the different dates correspond to different hemispheres).
So when people invented telescopes, it's no surprise that the sun became one of the tool's prime subjects. But observations taken centuries ago aren't exactly like the ones taken today. To compensate for that, the team streamlined the data to gain a clearer picture of how the sun is moving through its cycles.
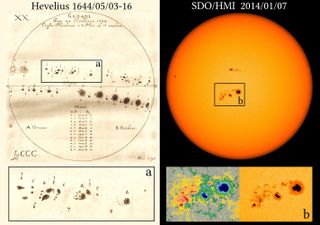
"When you try to understand what the sun has been doing for the last 400 years… you have to start using drawings," Muñoz-Jaramillo said. "You have to start using sunspot calendars that were made 400 years ago, 300 years ago, 200 years ago. Since people didn't understand exactly what they were seeing, the way [that] they were making all of these measurements was different… and so it is really hard to put them together."
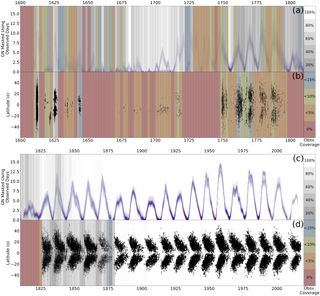
Muñoz-Jaramillo said he hopes the team's visualizations, which include measurements by 17th-century astronomers Johannes Hevelius, Christoph Scheiner, Galileo Galilei and others, show where future researchers should be careful in making conclusions. One set of observations that still puzzles scientists comes from the Maunder Minimum, a period of low solar activity that lasted 70 years, from about 1645-1715. While the Maunder Minimum is a potential "archetype" for a phenomenon called the grand minimum, these observations are less reliable than today's information on the sun, making evolutionary dots harder to connect.
Muñoz-Jaramillo added he hopes their work makes all this older data (and its appropriate context) much more accessible to those studying long-term solar variability.
The new work was detailed Monday (Dec. 10) in the journal Nature Astronomy.
Follow Doris Elin Salazar on Twitter@salazar_elin. Follow us @Spacedotcom, Facebook and Google+. Original article on Space.com.
Join our Space Forums to keep talking space on the latest missions, night sky and more! And if you have a news tip, correction or comment, let us know at: community@space.com.

Doris is a science journalist and Space.com contributor. She received a B.A. in Sociology and Communications at Fordham University in New York City. Her first work was published in collaboration with London Mining Network, where her love of science writing was born. Her passion for astronomy started as a kid when she helped her sister build a model solar system in the Bronx. She got her first shot at astronomy writing as a Space.com editorial intern and continues to write about all things cosmic for the website. Doris has also written about microscopic plant life for Scientific American’s website and about whale calls for their print magazine. She has also written about ancient humans for Inverse, with stories ranging from how to recreate Pompeii’s cuisine to how to map the Polynesian expansion through genomics. She currently shares her home with two rabbits. Follow her on twitter at @salazar_elin.
Most Popular


