Minority Report-Style 'Data CAVE' Created By Purdue Researchers
"I know what properties I want in order to get my job done, but I don't know what material, what molecular combinations, will give me that. It is a bit like 'Jeopardy.' You know the answer, but you are looking for the question."

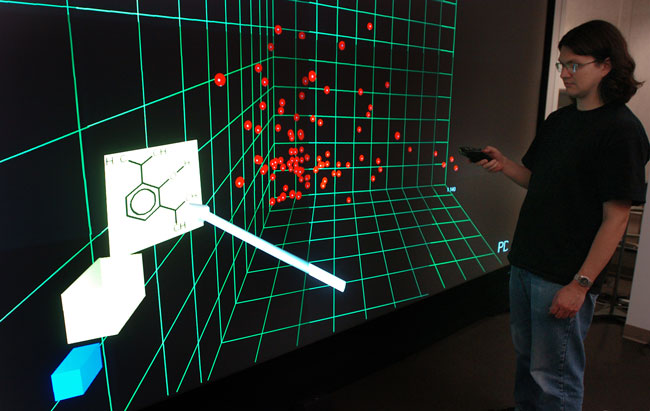
The new approach, called "discovery informatics," enables researchers to test out new theories and see how well their ideas work in real-time using a 3D display. Data is visualized on a 3D 12'x7' display. This allows scientists to see an entire problem, including chemical and atomic structures, graphs and charts. It will be tested in a new Center for Catalyst Design; catalysts account for billions of dollars in annual business revenues - even slight improvments can result in significant increases in profits.
For recent advances in computer-aided data mining techniques, see Data Mining In Three Dimensions. Read more about how discovery informatics goes beyond data-mining; learn more about CAVEs.
(This Science Fiction in the News story used with permission from Technovelgy.com - where science meets fiction.)
Get the Space.com Newsletter
Breaking space news, the latest updates on rocket launches, skywatching events and more!
Join our Space Forums to keep talking space on the latest missions, night sky and more! And if you have a news tip, correction or comment, let us know at: community@space.com.
Bill Christensen is the founder and editor of Technovelgy, a website dedicated to cataloguing the inventions, technology and ideas of science fiction writers. Bill is a dedicated reader of science fiction with a passion about science and the history of ideas. For 10 years, he worked as writer creating technical documentation for large companies such as Ford, Unisys and Northern Telecom and currently works to found and maintain large websites. You can see Bill's latest project on Twitter.
