Images: Milky Way's Monster Black Hole Shreds Space Cloud (Gallery)
Gas Cloud Ripped Apart by Black Hole
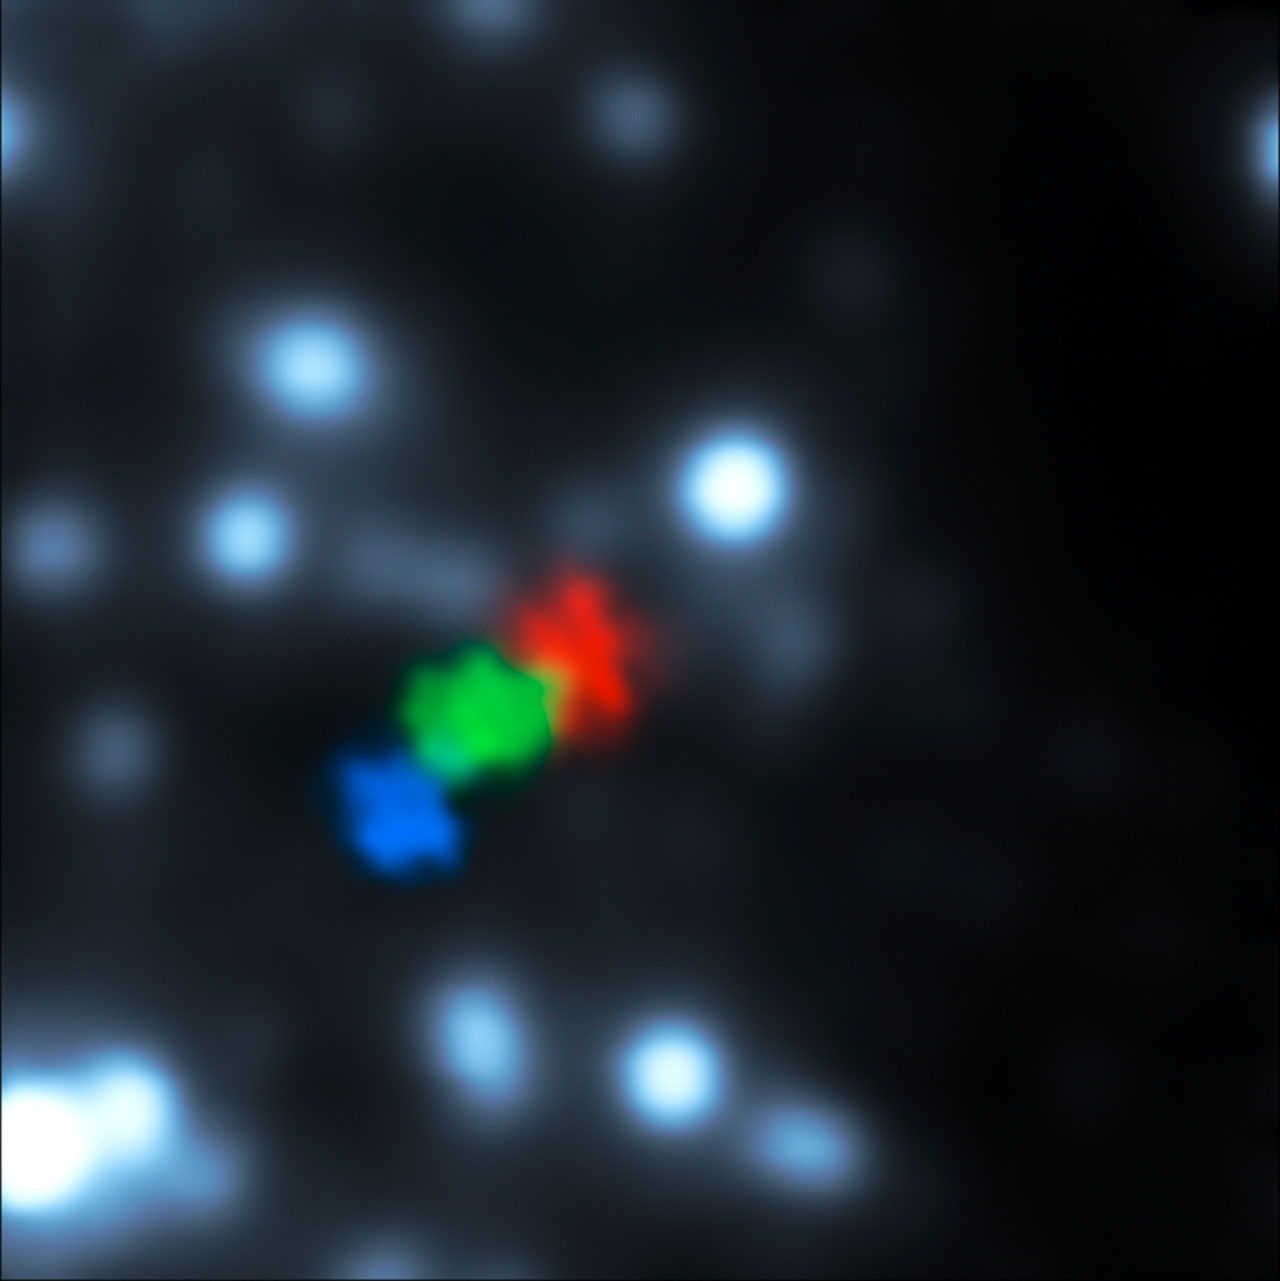
New observations from ESO’s Very Large Telescope show for the first time a gas cloud being ripped apart by the supermassive black hole at the centre of the galaxy. Shown here are VLT observations from 2006, 2010 and 2013, coloured blue, green and red respectively. Image released July 17, 2013.
Simulation of a Gas Cloud Passing Close to Supermassive Black Hole
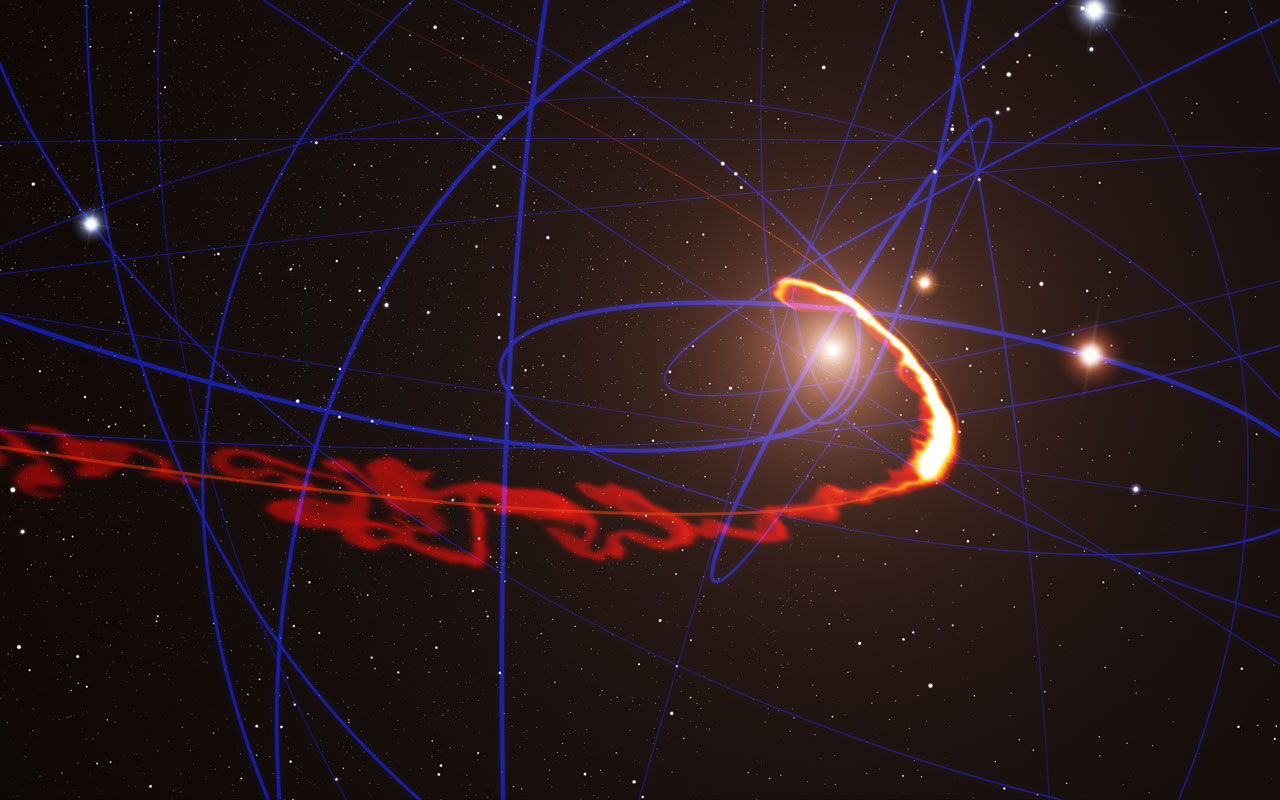
This simulation of a gas cloud passing close to the supermassive black hole at the centre of the galaxy shows the situation in mid-2013. Image released July 17, 2013.
Gas Cloud Ripped Apart
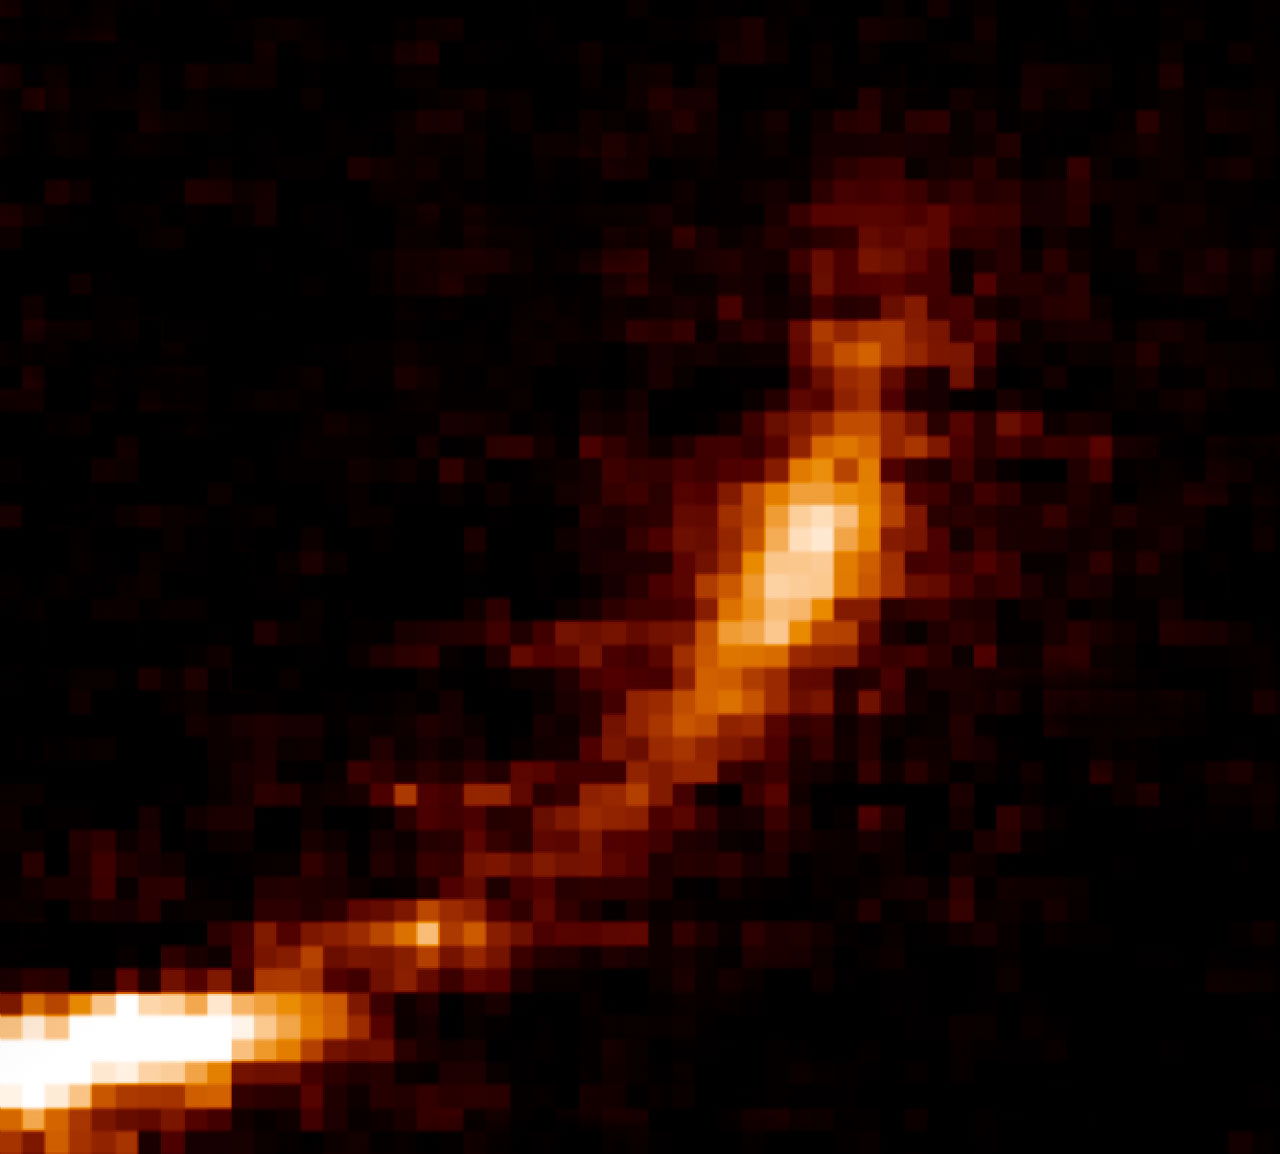
New observations from ESO’s Very Large Telescope show how a gas cloud now passing close to the supermassive black hole at the center of the galaxy is being ripped apart. The horizontal axis shows the extent of the cloud along its orbit and the vertical axis shows the velocities of different parts of the cloud. Image released July 17, 2013.
Gas Cloud Ripped Apart (Labeled)
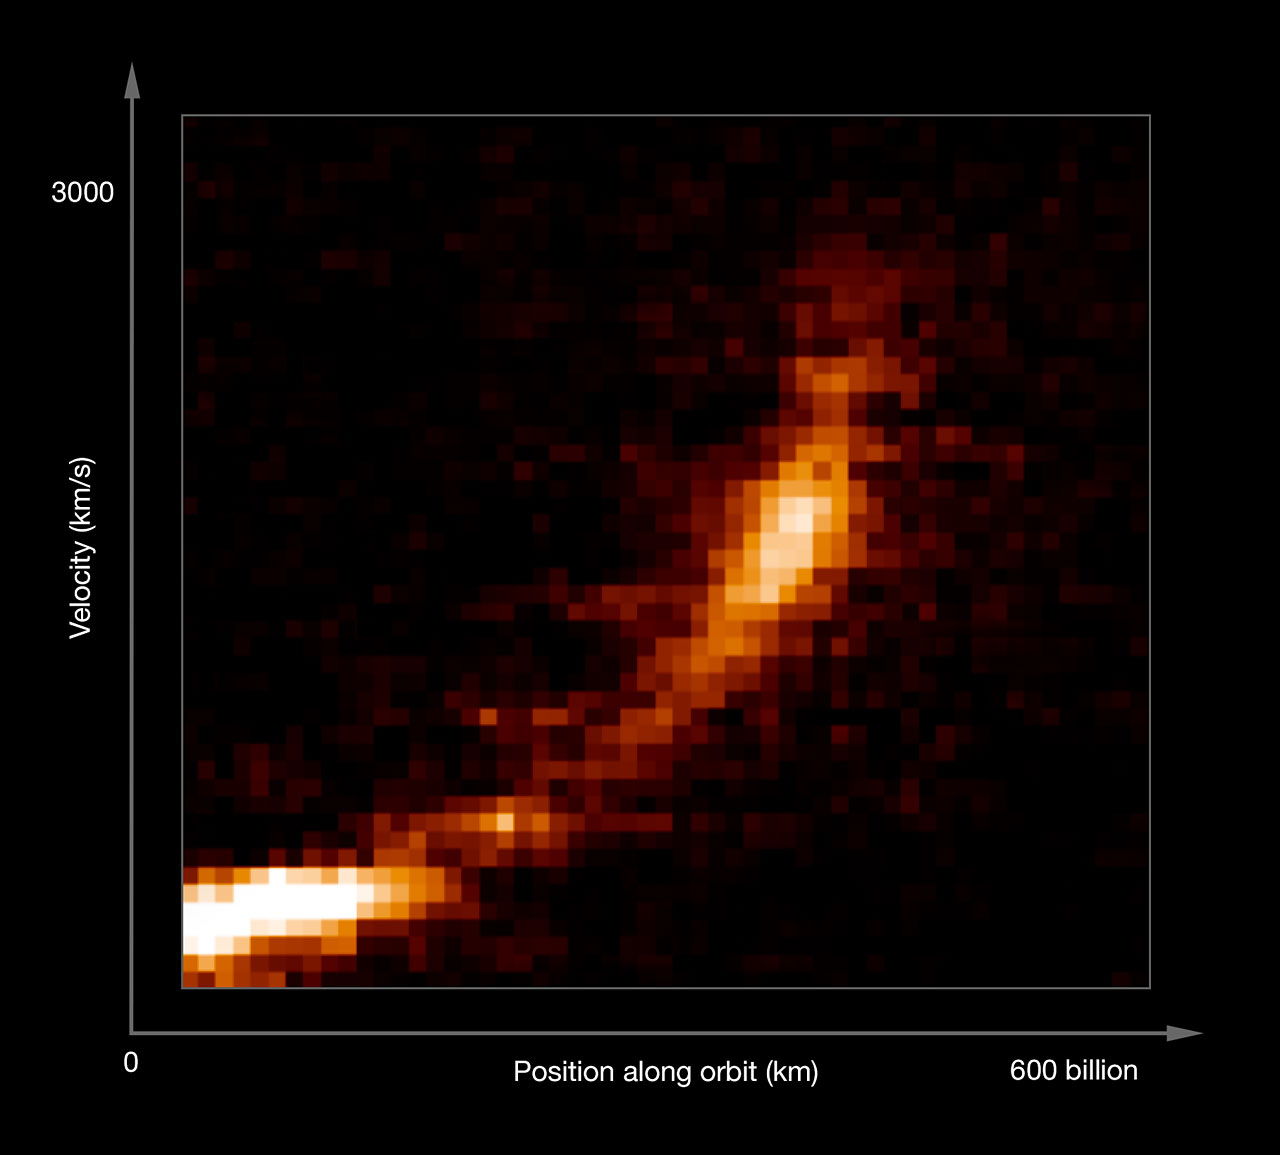
New observations from ESO's Very Large Telescope show how a gas cloud now passing close to the supermassive black hole at the centre of the galaxy is being ripped apart. The horizontal axis shows the extent of the cloud along its orbit and the vertical axis shows the velocities of different parts of the cloud. Image released July 17, 2013.
Gas Cloud Ripped Apart by Black Hole — Images

These observations from ESO’s Very Large Telescope, using the SINFONI instrument, show how a gas cloud is being stretched and ripped apart as it passes close to the supermassive black hole at the center of the galaxy. The horizontal axis shows the extent of the cloud along its orbit and the vertical axis shows the velocities of different parts of the cloud during the last ten years. Image released July 17, 2013.
Infrared Images Showing Gas Cloud

Series of infrared images showing the central region of our Milky Way galaxy. The gas cloud (indicated by an arrow) is unambiguously detected up to 2012, in the latest images however its surface brightness is too low for a firm detection. Image released July 16, 2013.
Position-Velocity Diagram of the Gas Cloud
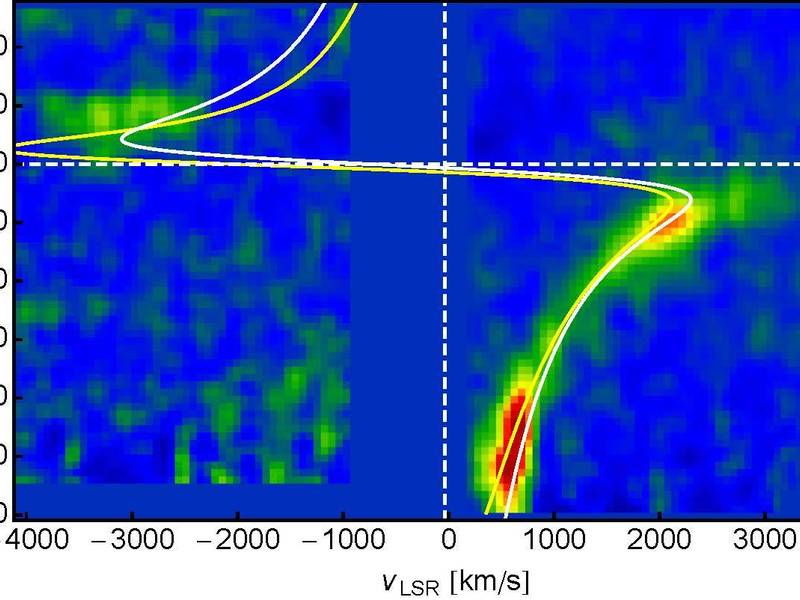
A position-velocity diagram of the gas cloud extracted from the latest observations with SINFONI. The spatial axis marks the direction along the orbit, the other gives the measured velocity at each point. A small part of the cloud can already be seen past the pericentre to the black hole (top left-hand side) while the head and tail structures of the gas cloud are still on approach. The two lines indicate orbits calculated on the basis of two different assumptions. Image released July 16, 2013.
Get the Space.com Newsletter
Breaking space news, the latest updates on rocket launches, skywatching events and more!
Gas Cloud G2 Position-Velocity Diagrams 2004-2013
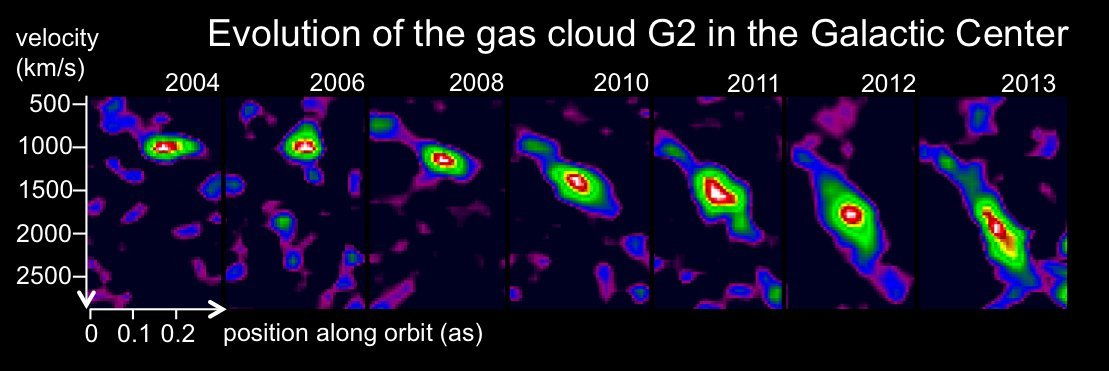
Series of position-velocity diagrams from 2004 to 2013, which were scaled to identical peak luminosities. Over time, the gas cloud becomes increasingly stretched, as can clearly be seen, due to the gravitational shear of the black hole. Image released July 16, 2013.
Join our Space Forums to keep talking space on the latest missions, night sky and more! And if you have a news tip, correction or comment, let us know at: community@space.com.

Space.com is the premier source of space exploration, innovation and astronomy news, chronicling (and celebrating) humanity's ongoing expansion across the final frontier. Originally founded in 1999, Space.com is, and always has been, the passion of writers and editors who are space fans and also trained journalists. Our current news team consists of Editor-in-Chief Tariq Malik; Editor Hanneke Weitering, Senior Space Writer Mike Wall; Senior Writer Meghan Bartels; Senior Writer Chelsea Gohd, Senior Writer Tereza Pultarova and Staff Writer Alexander Cox, focusing on e-commerce. Senior Producer Steve Spaleta oversees our space videos, with Diana Whitcroft as our Social Media Editor.
