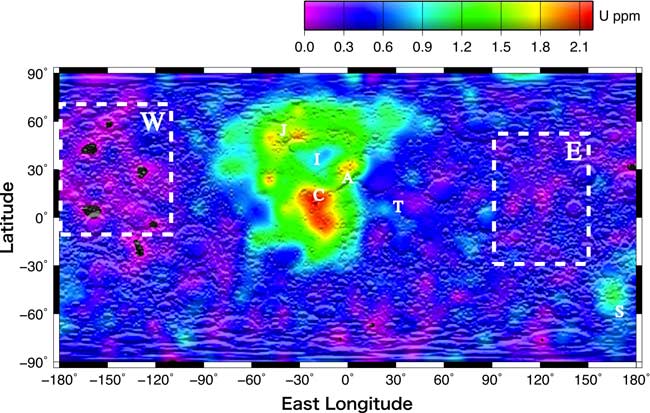
New Moon Map Shows Uranium in Short Supply

Anew map of uranium on the moon has revealed the lunar surface to be a poorsource of the radioactive stuff, but it could help solve mysteries as to howthe moon formed.
Thisnew moonuranium map dampens hopes of a nuclear power industry on the lunar surface,researchers said.
Proponentsof lunarbases and future lunar colonies have long pointed to many of the moonsminerals, along with water, as being useful to support such efforts.
"Forgetthings like uranium mines or nuclear reactors," said cosmochemist RobertReedy, a member of the Kaguya science team and a senior scientist at theTucson-based Planetary Science Institute. "The concentrations are very farfrom being of commercial levels."
Uranium on the moon
Thenew map was created using data from Japan's Kaguya spacecraft, which launched in 2007. The spacecraft found uraniumon the moon, along with other radioactive elements, with its advanced gamma-rayspectrometer.
Kaguya crashedinto the moon's surface at the end of its mission last year.
Breaking space news, the latest updates on rocket launches, skywatching events and more!
Thenew moon uranium map clearly shows the element is not abundant on the moon. Inmoon rock, it appears in quantities less than in many Earth granites.
Moon's early history
Still, by analyzingthe ratio between the naturally radioactive elements uranium and thoriumscientists may yield new insights into the formation and evolution of the moon's surface. In the new map, significant variations in theratio between uranium and thorium were revealed.
Forinstance, averageuranium abundances could differ by some 60 percent between the east and westhighlands on the far side of the moon, while thorium abundances between thoseareas varied only 10 percent.
Thesenew findings suggest the formation of the lunar crust might not be as uniformas had long been thought.
"TheKaguya gamma-rayspectrometer team wantsto finish getting maps for as many elements as possible before drawing detailed conclusionson the Moon's history," Reedy said.
Thescientists detailed their findings online May 20 in the journal GeophysicalResearch Letters.
- Gallery— Future Moon Base Visions
- PhotoAlbum: Farewell, Moon Probe Kaguya!
- Shortageof Rare Earth Elements Could Thwart Innovation

Charles Q. Choi is a contributing writer for Space.com and Live Science. He covers all things human origins and astronomy as well as physics, animals and general science topics. Charles has a Master of Arts degree from the University of Missouri-Columbia, School of Journalism and a Bachelor of Arts degree from the University of South Florida. Charles has visited every continent on Earth, drinking rancid yak butter tea in Lhasa, snorkeling with sea lions in the Galapagos and even climbing an iceberg in Antarctica. Visit him at http://www.sciwriter.us
