Vast Universe Map Charts Our 2 Billion Light-Year Wide Cosmic 'Hood
If you ever wanted to take your starship on an intergalactic joyride, astrophysicists have got your back — they've just created the most detailed cosmic 3-D map to date, spanning an mind-boggling distance of 2 billion light-years.
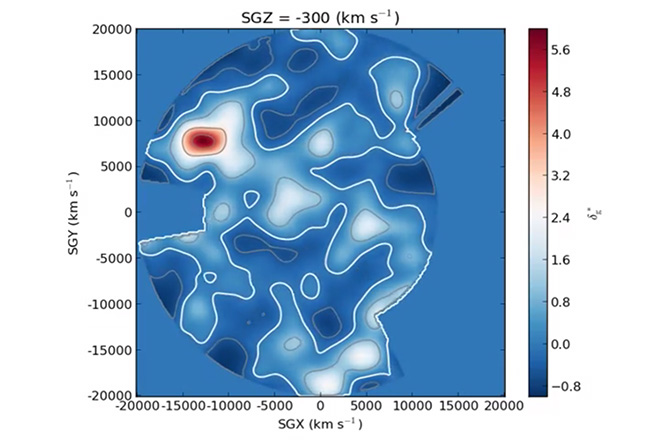
Astrophysicists constructed the spherical map from red shift data of galaxies and galaxy clusters. From these data, they were able to plot all the concentrations of matter in the local universe, tracing out massive clusters and the voids in between.
ANALYSIS: Mysterious 'Cold Spot': Fingerprint of Largest Structure in the Universe?
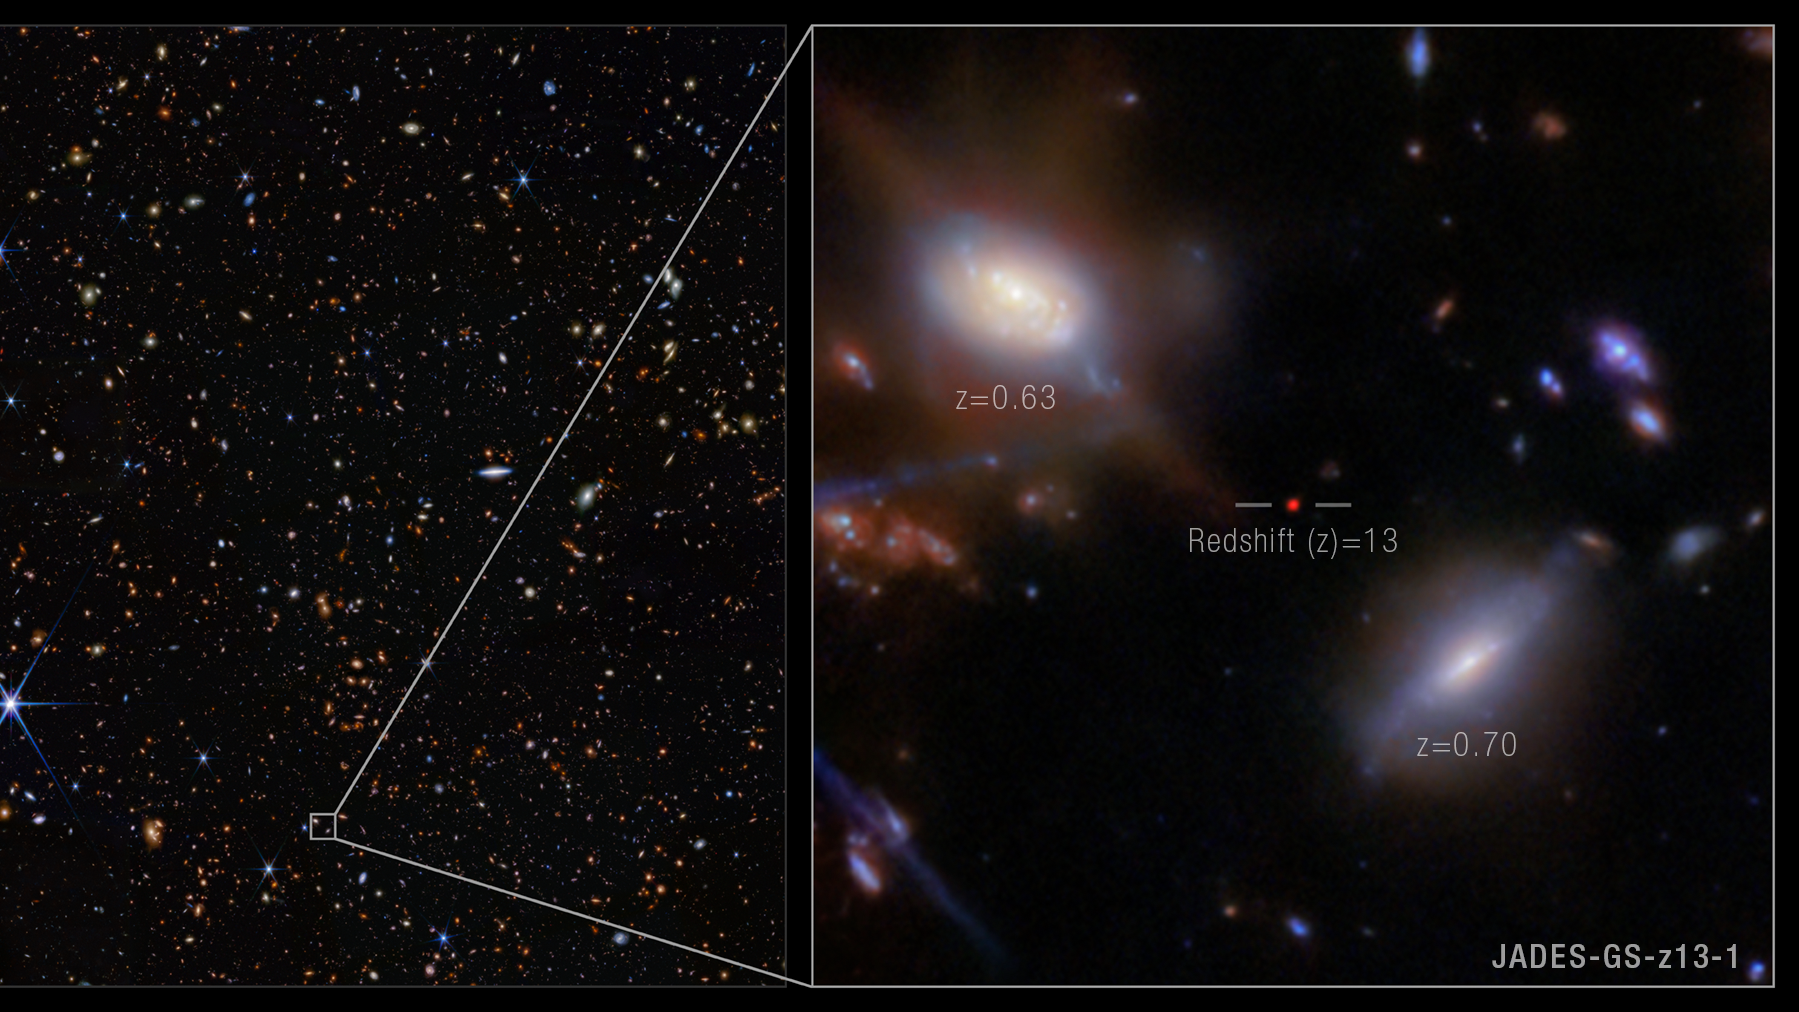
By studying the light emitted by distant galaxies, astronomers are able to see how shifted the wavelength of light is towards the red. The greater its red-shift, the greater the galaxy’s distance from us. By assembling all the available red shift data from galaxies within the 2 billion light-year wide sphere, the researchers arrived at this amazingly detailed 3-D model of our local universe, detailing the most massive superclusters and the emptiest of voids. [The Universe: Big Bang to Now in 10 Easy Steps]
They hope to use this map to unlock some of the mysteries behind the distribution of dark matter — the invisible stuff that is thought to make up 85 percent of the mass in the known universe. The structure of the map also gives us some clue about the origins of our universe.
"The galaxy distribution isn't uniform and has no pattern," said Michael Hudson of the University of Waterloo. "It has peaks and valleys much like a mountain range. This is what we expect if the large-scale structure originates from quantum fluctuations in the early universe."
PHOTO: Hubble Builds 3D Dark Matter Map
Get the Space.com Newsletter
Breaking space news, the latest updates on rocket launches, skywatching events and more!
Since the Big Bang, nearly 14 billion years ago, the universe has been expanding at an acclerated rate. Therefore, one would expect all galaxies and clumps of visible matter to be moving away in a roughly uniform manner. This isn't the case, however; galaxies and galactic clusters appear to drift toward and away one another beyond what is predicted by the measured expansion of the universe. These excess motions are known as "peculiar velocities" and Hudson’s team hopes to use this map to better chart what could be causing these motions -- chief suspect being the gravitational tug of dark matter.
"A better understanding of dark matter is central to understanding the formation of galaxies and the structures they live in such as galaxy clusters, superclusters and voids," said Hudson.
This research has been published in the journal Monthly Notices of the Royal Astronomical Society.
Next up is to accurately measure all the peculiar motions within this vast spherical map, but for now, take a tour of our local universe in the video shown below:
For more information on how this map was created, browse the University of Waterloo press release.
This article was provided by Discovery News.
Join our Space Forums to keep talking space on the latest missions, night sky and more! And if you have a news tip, correction or comment, let us know at: community@space.com.
Ian O'Neill is a media relations specialist at NASA's Jet Propulsion Laboratory (JPL) in Southern California. Prior to joining JPL, he served as editor for the Astronomical Society of the Pacific‘s Mercury magazine and Mercury Online and contributed articles to a number of other publications, including Space.com, Space.com, Live Science, HISTORY.com, Scientific American. Ian holds a Ph.D in solar physics and a master's degree in planetary and space physics.
