Concerning satellite observations show major cities on US East Coast are sinking
“Continuous unmitigated subsidence on the U.S. East Coast should cause concern."

Images collected by numerous satellites have shown that major cities and population centers across the U.S. East Coast are sinking.
Land sinking, or "subsidence," as seen by these satellites, is dangerous because it can undermine the foundations of buildings, potentially causing collapse. It can also damaging roads as well as gas and water lines. When coupled with rising sea levels caused by human-driven climate change, subsidence in coastal regions can increase the risk of flooding and worsen subsequent damage.
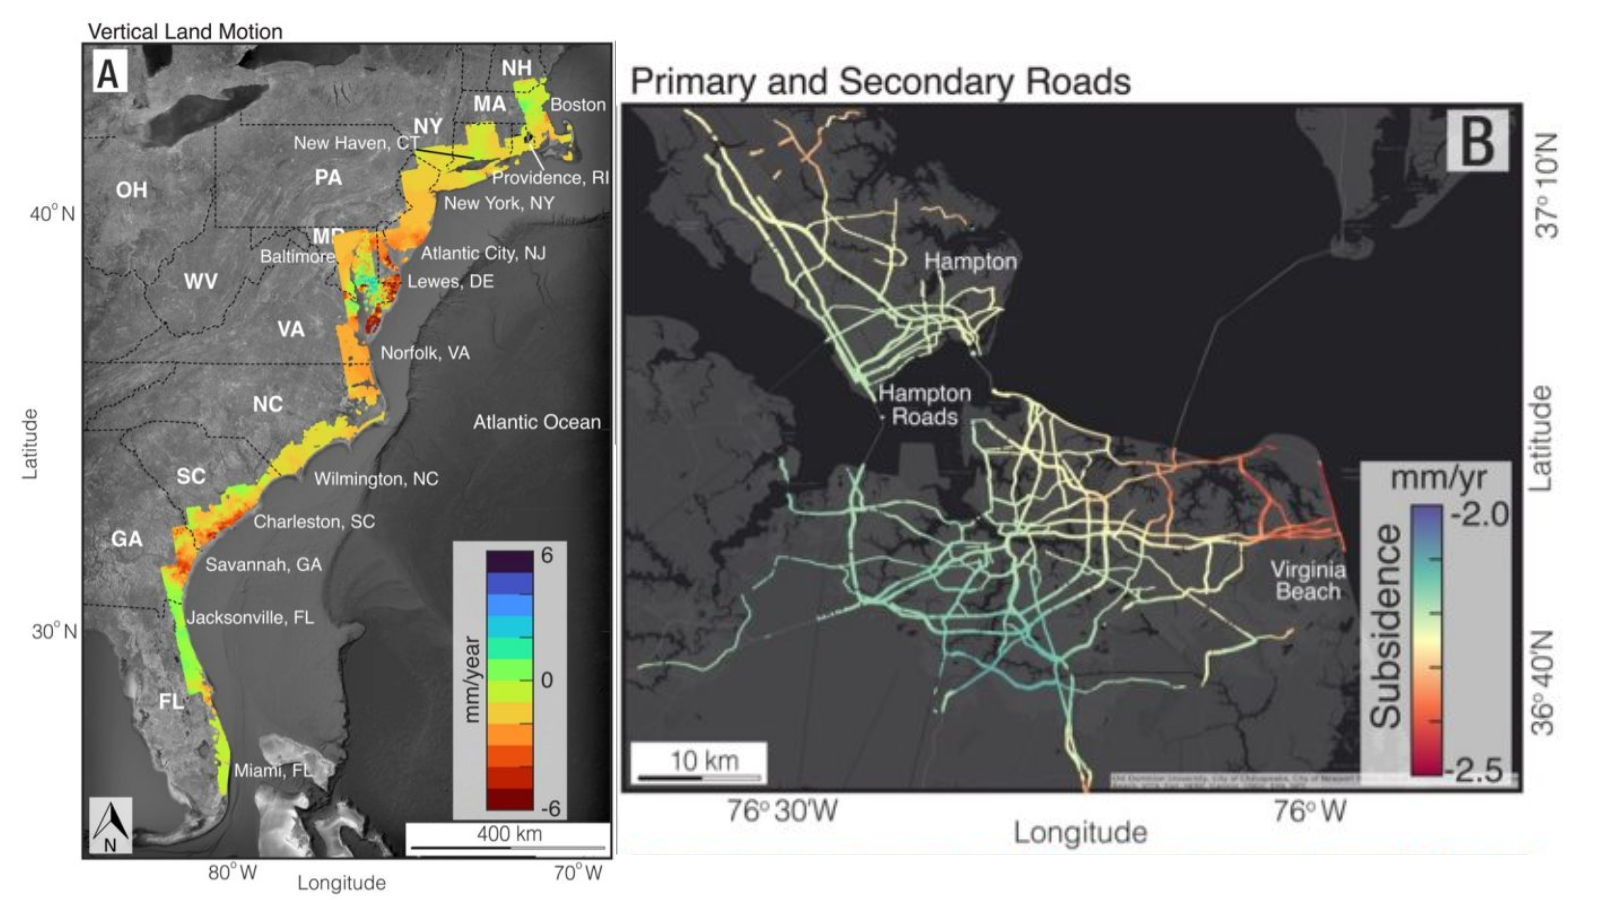
Among the particularly hard-hit areas are New York City, Long Island, Baltimore, Virginia Beach, and Norfolk, which are experiencing areas of rapid subsidence next to slower-sinking regions and even stable patches of land. This poses a risk to infrastructure like roads, building foundations, pipelines, rail lines and even airport runways.
The new research from Virginia Tech and the U.S. Geological Survey (USGS) shows that some areas of the U.S. East Coast are sinking as rapidly as 5 millimeters (0.2 inches) per year, a rate of subsidence at the edge of the Atlantic Ocean that outstrips global sea level rise.
Related: Satellites watch as Japan's new volcanic island continues to grow (image)
"Continuous unmitigated subsidence on the U.S. East Coast should cause concern,” Leonard Ohenhen, research lead author and a graduate student at the Virginia Tech Earth Observation and Innovation Lab, said in a statement. "This is particularly in areas with a high population and property density and a historical complacency toward infrastructure maintenance."
A sinking feeling
Together with Virginia Tech Earth Observation and Innovation Lab Associate Professor Manoochehr Shirzaei, Ohenhen and colleagues collected a huge amount of data from space-based radar satellites to build digital maps of terrain.
Get the Space.com Newsletter
Breaking space news, the latest updates on rocket launches, skywatching events and more!
They then measured millions of subsidence occurrences over many years, following up by constructing some of the first-ever high-resolution images of sinking land.
The team's maps showed that a large number of U.S. East Coast areas sinking by at least 2 mm (0.08 in) per year. Additionally, the scientists found areas along the mid-Atlantic coast, amounting to over 1,400 square miles (3,626 square kilometers), that are sinking by 5 mm (0.2 in) per year or more. The current rate of global sea-level rise, which is around 4 mm (0.16 in) per year.
"We measured subsidence rates of 2 millimeters per year affecting more than 2 million people and 800,000 properties on the East Coast," Shirzaei said. "We know to some extent that the land is sinking. Through this study, we highlight that sinking of the land is not an intangible threat. It affects you and I and everyone, it may be gradual, but the impacts are real."

Ohenhen pointed out how the problem with the subsidence mapped isn't just that land is sinking, but also that "hotspots" of subsidence are occurring in population hubs and around concentrations of infrastructure.
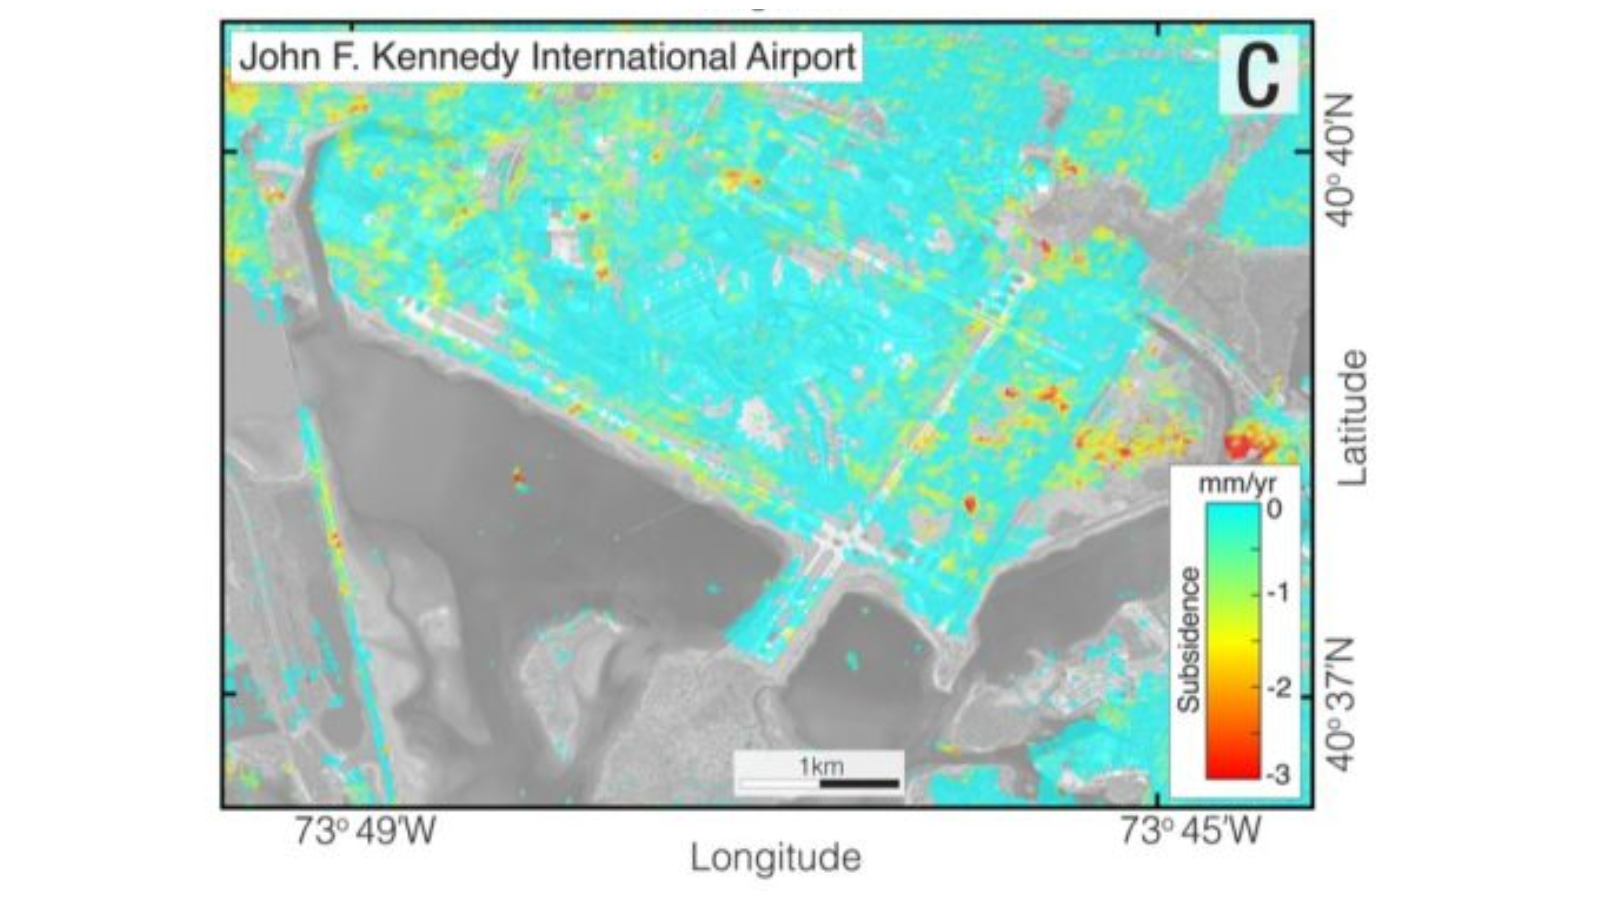
"For example, significant areas of critical infrastructure in New York, including JFK and LaGuardia airports and its runways, along with the railway systems, are affected by subsidence rates exceeding 2 mm per year," he added. "The effects of these right now and into the future are potential damage to infrastructure and increased flood risks."
"This information is needed. No one else is providing it," USGS research geologist and study co-author Patrick Barnard said in the statement. "Shirzaei and his Virginia Tech team stepped into that niche with his technical expertise and are providing something extremely valuable."
The team's research was published on Tuesday (Jan. 2) in the journal Proceedings of the National Academy of Sciences.
Join our Space Forums to keep talking space on the latest missions, night sky and more! And if you have a news tip, correction or comment, let us know at: community@space.com.

Robert Lea is a science journalist in the U.K. whose articles have been published in Physics World, New Scientist, Astronomy Magazine, All About Space, Newsweek and ZME Science. He also writes about science communication for Elsevier and the European Journal of Physics. Rob holds a bachelor of science degree in physics and astronomy from the U.K.’s Open University. Follow him on Twitter @sciencef1rst.
-
Unclear Engineer This is really just better measurements of something that is "old news".Reply
The area I live in, the "Delmarva Peninsula" between the Chesapeake Bay and the Atlantic Ocean, has been measured to sink from about 2 to 5 mm per year for decades.
There are several reasons, acting at the same time, but mostly independently.
The most basic one is that this part of North America was not covered by an ice sheet during the last ice age, so it got pushed up as the heavy ice sheet pushed down the adjacent areas. Now that those ice sheets have melted away, this area is sinking back down as the areas where the ice once was are rising up. It is a slow process that is still going on.
But, on the Delmarva Peninsula, another factor is that large amounts of ground water are being pumped out to water crops (and now some golf courses). That also causes the ground to "settle" lower.
And, in some areas, heavy infrastructure has been built on land that is somewhat soft, and the road fills and buildings are sinking into the surrounding soils by perceptible amounts.
Where I live, the net effect has been about 6" difference in the local water level since about 1980. It is causing perceptible differences in the frequency and depth of the water on the road leading to my small community.
I expect that change rate to accelerate as global warming causes ice sheets in Greenland and Antarctica to melt faster and raise sea level faster. But, up until now, that has been merely half the total effect.
The benefit of the satellite measurements is that it help see the changes more accurately in real time.
But, I realize that the house I live in today will eventually be under water. This whole region has been underwater repeatedly over the last few million years, and I don't think it would stay above sea level even if humans were not affecting the environment. During the last interglacial period, the evidence is that sea level peaked about 25 feet higher than it is right now. And, at its lowest, about 25,000 years ago, it was about 325 feet lower than it is right now.
So, I think we need to start planning for dealing with the expected rise, and use the best data to help set the timing for scheduling our planned infrastructure modifications.


