NASA confirms summer 2023 was Earth's hottest on record

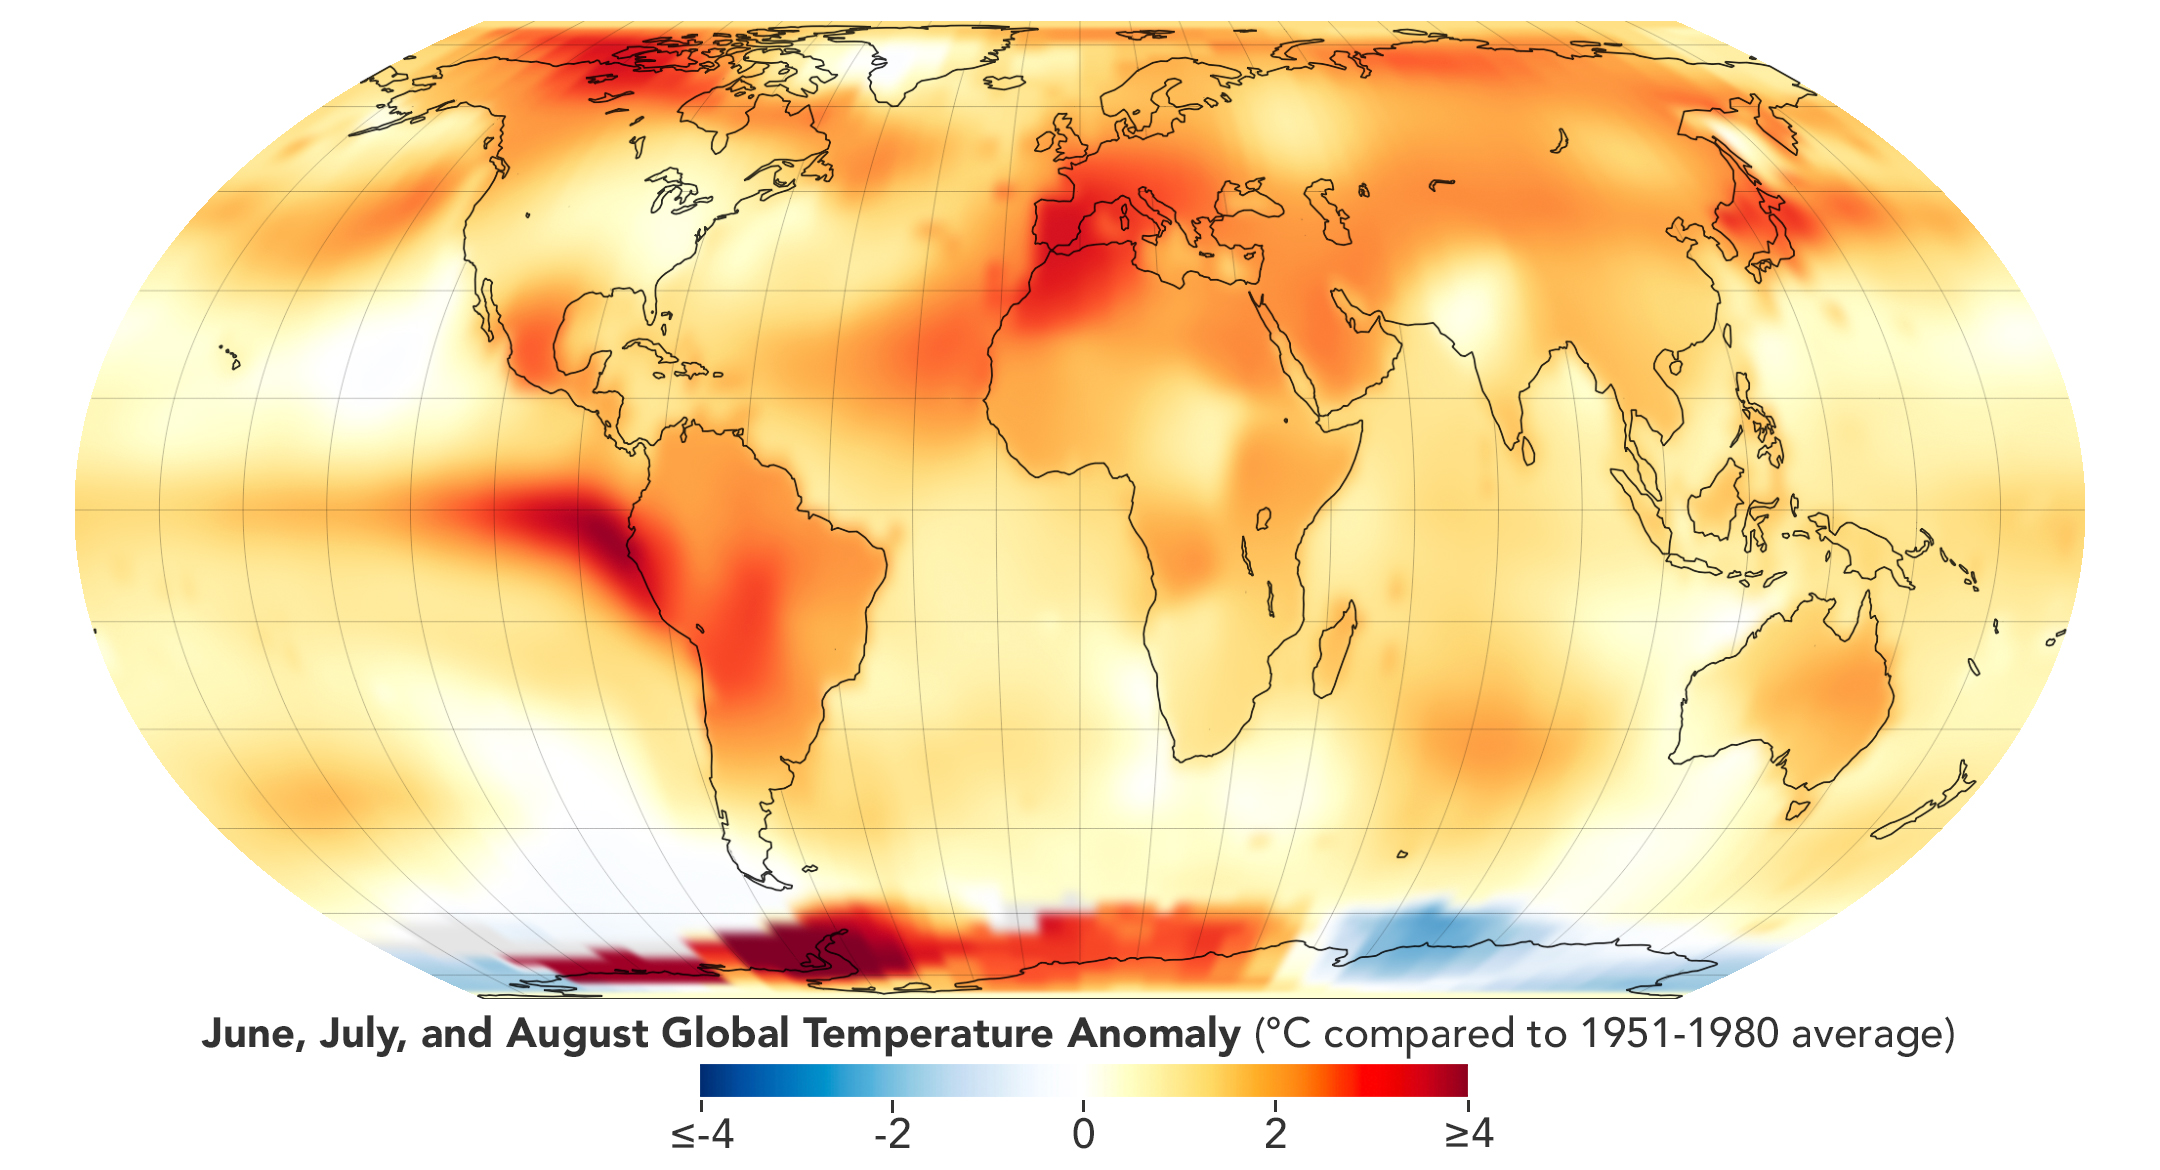
A map with shades of red, yellow and orange depicting global temperature anomalies for meteorological summer in 2023 compared to a baseline average from 1951 to 1980.
This map depicts global temperature anomalies for meteorological summer in 2023 (June, July, and August). It shows how much warmer or cooler different regions of Earth were compared to the baseline average from 1951 to 1980. (Image credit: NASA Earth Observatory/Lauren Dauphin)

Scorching heat waves in North America, Europe, Asia and elsewhere have deemed this year's summer as Earth's hottest since at least 1880, NASA confirmed yesterday (Sept. 14), referring to when global record-keeping of temperatures began.

2023's record-setting heat is a result of human-driven global warming and is compounded by a brewing, recurring climate pattern known as El Niño, according to the space agency.

A statement outlining the analysis says August alone was 2.2 degrees Fahrenheit (1.2 degrees Celsius) warmer than an average summer, blanketing a record 57 million people in the southern and southwest U.S. under a heat wave of the most severe category.

Temperatures in June, July and August combined were 0.41 degrees Fahrenheit (0.23 degrees Celsius) warmer than all previous summers, according to the latest report. In another NASA conference on the planet's climate emergency last month, scientists confirmed July of this year to be the hottest on record, with the previous five hottest Julys all in the past five years.

"Just look around you and you'll see what's happened," NASA administrator Bill Nelson said during the conference. "We have record flooding in Vermont. We have record heat in Phoenix and in Miami. We have major parts of the country that have been blanketed by wildfire smoke and, of course, what we are watching in real-time is the disaster that has occurred in Hawaii with wildfires."

Related: Satellites reveal catastrophic year for emperor penguins amid climate crisis in Antarctica

July's searing heat directly contributed to the deadliest wildfire season on record for both Canada and Hawaii, as well as to severe rainfall and flash floods across the Mediterranean including in Greece and Italy, scientists say. 

They attribute this record heat in part to El Niño, which occurs about every two to seven years when winds above the Pacific ocean, which normally blow to the west along the equator  from South America towards Asia, break their routine and drift east and toward the U.S. west coast. As a result, Canada and the U.S. witness much warmer conditions than usual.

"Exceptionally high sea surface temperatures, fueled in part by the return of El Niño, were largely responsible for the summer's record warmth," Josh Willis, who is a climate scientist and oceanographer at NASA's Jet Propulsion Laboratory in California, said in a statement. His team predicts the biggest impacts from this climate pattern will unfold February through April next year.

However, as Gavin Schmidt, a climate scientist and director of GISS, explained during July's conference, natural weather patterns like El Niño contribute minimally to climate change when compared to human activities driving global warming. El Niño in particular is calculated to lead to a temporary temperature increase of about 0.1 degrees Celsius, according to agency data. Global warming observed so far exceeds that quantity. 

"Without those human contributions to the drivers of climate change, we would not be seeing anything like the temperatures that we're seeing right now," he said.

The new analysis, done by Willis and his team at the NASA Goddard Institute of Space Studies (GISS) in New York, comes just a day after a different team of scientists warned human activity has taken the world beyond a safe operating zone. Six of the nine so-called planetary constraints of the global environment, which assess how much humans have deviated from the pre-industrial world, have been breached, the team had found.

The latest update from NASA also comes at the heels of another report by the World Meteorological Organization stating nations are not on track to meet the long-term goals previously agreed upon in the Paris Agreement to cap rising temperatures worldwide.

Heat waves are becoming more common and severe, a trend scientists expect to continue in the coming years, but this year shows they are also occurring at unexpected times. Just as one example, in early September, an unusually late three-day heat wave in New York City broke records after temperatures spiked by 20 degrees higher than usual.

"Unfortunately, climate change is happening. Things that we said would come to pass are coming to pass," Schmidt, said in the recent statement. "And it will get worse if we continue to emit carbon dioxide and other greenhouse gases into our atmosphere."

Join our Space Forums to keep talking space on the latest missions, night sky and more! And if you have a news tip, correction or comment, let us know at: community@space.com.

Sharmila Kuthunur
Contributing Writer

Sharmila Kuthunur is a Seattle-based science journalist focusing on astronomy and space exploration. Her work has also appeared in Scientific American, Astronomy and Live Science, among other publications. She has earned a master's degree in journalism from Northeastern University in Boston. Follow her on BlueSky @skuthunur.bsky.social

  • perilun
    But most of the lower 48 states are light yellow in the map, suggesting an historically average year.
    Reply
  • Helio
    There is no mention of the Tonga volcanic explosion that has increased the stratospheric global warming product of water vapor by ~10%, not to mention lower level increases. It is estimated it has increased global temperatures and will do so for perhaps another five years. This was an unusual sub-surface eruption.

    The question that keeps getting suppressed is the "how much?" is due to this or that. The consensus of scientists is that humans do contribute to warming, but there is no consensus on "how much" is due to humans, especially from China as they continue to build many new coal power plants.

    The "how much?" is what the climate models are attempting to do, but the complexity is not yet in their grasp.

    The horrible fires in Maui, IMO, is more a study of negligence and possible leadership incompetence than about CO2.
    Reply
  • perilun
    Helio said:
    There is no mention of the Tonga volcanic explosion that has increased the stratospheric global warming product of water vapor by 10%. It is estimated it has increased global temperatures and will do so for perhaps another five years. This was an unusual sub-surface eruption.

    The question that keeps getting suppressed is the "how much" is due to this or that. The consensus of scientists is that humans do contribute to warming, but there is no consensus on "how much" is due to humans, especially from China as they continue to build many new coal power plants.

    The "how much" is what the climate models are attempting to do, but the complexity is not yet in their grasp.

    The horrible fires in Maui, IMO, is more a study of negligence and possible leadership incompetence than about CO2.
    All good observations.
    Reply
  • CorinGetorix
    perilun said:
    But most of the lower 48 states are light yellow in the map, suggesting an historically average year.
    Please read the headline again. "Earth" is not the United States.
    Reply
  • Helio
    CorinGetorix said:
    Please read the headline again. "Earth" is not the United States.
    But the article addresses various locations for extreme heat, including the US.

    "A statement outlining the analysis says August alone was 2.2 degrees Fahrenheit (1.2 degrees Celsius) warmer than an average summer, blanketing a record 57 million people in the southern and southwest U.S. under a heat wave of the most severe category."
    The map appears to be in contradiction to this claim.
    Reply
  • CorinGetorix
    Helio said:
    But the article addresses various locations for extreme heat, including the US.

    "A statement outlining the analysis says August alone was 2.2 degrees Fahrenheit (1.2 degrees Celsius) warmer than an average summer, blanketing a record 57 million people in the southern and southwest U.S. under a heat wave of the most severe category."
    The map appears to be in contradiction to this claim.
    It doesn't contradict it at all. Southern states are the hottest states already. By increasing the average temperature by any amount, a hot state that already experiences severe heatwaves will just experience even more severe heatwaves. It doesn't matter that the value hasn't gone up by much, it's still unbearably hot.

    The map is measuring temperature anomalies, and the sentence you've highlighted is measuring the amount of people under severe heatwaves.
    Reply
  • Helio
    CorinGetorix said:
    The map is measuring temperature anomalies,
    Correct.

    CorinGetorix said:
    and the sentence you've highlighted is measuring the amount of people under severe heatwaves.
    They aren't "measuring the amount of people under severe heatwaves." The map is a regional map, not a population map. The eastern half of the US shows the anomaly to be about 0.5 to 1 deg. C. South Texas is one of the few regions showing the higher temperature anomaly over 1C. This is where I live and it has been very hot this summer, unusually so. Though the 1930s were much hotter.

    So the proper question to ask is "why?". Some of this is due to the higher CO2 increase. Most is due, IMO, to several additional reasons: El Nino event; the Tonga eruption; lower sulfide levels (reducing cloud formations), and more.
    Reply
  • Ken Fabian
    perilun said:
    All good observations.
    Sorry, looks more like "Look, I found a straw! Let's make a grasp for it".
    The potential for the Tonga eruption to raise global temperatures (rather than the more usual lowering) was noticed and pointed out by mainstream climate scientists and some have looked closer and sought to estimate the impacts (with more such studies still in progress - and is likely to keep being revisited). They have been looking at both the warming potential of the water vapor released and the cooling of the aerosols and so far and came up with variations of expected contributions, somewhere between a small amount of cooling overall up to a few hundredths of a degree C of warming. And currently temperatures are tracking higher by 0.2 to 0.5 C higher, ie exceeding 10X that, from other causes. And the highest ever CO2 emissions and atmospheric concentrations are the biggest of them.

    Most of that year to year difference is probably from coming out of la Nina ENSO phase and heading into el Nino, plus the underlying global warming trend. Most of the developing el Nino impact hasn't emerged yet, so it is likely 2023 and 2024 will break existing global temperature records. Which the Doubt, Deny, Delay crowd (well represented here) will almost certainly seek to find cause to downplay, doubt and deny.

    The hottest Summer on record has occurred during a la Nina year - ie during a cool phase of ENSO - and that looks like another threshold is being crossed - but most (not all) of the commenters here seek cause - any cause - to downplay or deny the significance of that.
    Reply
  • CorinGetorix
    Helio said:
    Correct.


    They aren't "measuring the amount of people under severe heatwaves." The map is a regional map, not a population map. The eastern half of the US shows the anomaly to be about 0.5 to 1 deg. C. South Texas is one of the few regions showing the higher temperature anomaly over 1C. This is where I live and it has been very hot this summer, unusually so. Though the 1930s were much hotter.

    So the proper question to ask is "why?". Some of this is due to the higher CO2 increase. Most is due, IMO, to several additional reasons: El Nino event; the Tonga eruption; lower sulfide levels (reducing cloud formations), and more.
    I am aware that they are not specifically measuring the amount of people under severe heatwaves. That was not my point.

    My point was that the map *does not* contradict, as you claimed, having people be affected by heatwaves in the southern US despite the (comparatively, it's still higher than usual) low anomalous temperature.

    It's nice that you have an opinion as to why the year has been so hot. I don't know where you got it from, because the article says:

    "However, as Gavin Schmidt, a climate scientist and director of GISS, explained during July's conference, natural weather patterns like El Niño contribute minimally to climate change when compared to human activities driving global warming. El Niño in particular is calculated to lead to a temporary temperature increase of about 0.1 degrees Celsius, according to agency data. Global warming observed so far exceeds that quantity.

    "Without those human contributions to the drivers of climate change, we would not be seeing anything like the temperatures that we're seeing right now," he said."

    So forgive me for not placing a ton of faith in your hunch, and instead trusting NASA.
    Reply
  • Helio
    CorinGetorix.

    NASA…. https://climate.nasa.gov/news/3204/tonga-eruption-blasted-unprecedented-amount-of-water-into-stratosphere/
    Nature....https://phys.org/news/2023-01-tonga-eruption-chances-global-temperature.html

    Here's a very in-depth analysis that considers many variables....
    https://judithcurry.com/2023/08/14/state-of-the-climate-summer-2023/
    There is agreement that the Tonga eruption will have an impact on increasing temperatures perhaps for seven years, but, as Ken noted, this will only be a very small increase (per current modeling). I was not arguing the Tonga is the reason for higher temperatures, but that countless variables, including new ones like Tonga, are required to make better climate analyses.

    We don't have Newtonian-like models (perfect results), though great efforts are underway to provide reliable modeling. Planetary exploration of other atmospheres is seeking funding to a large extent for the purpose of understanding those climates so we can better model our climate. Why make that argument if our climate models are near perfect now? They're not.

    Please drop your use of ad hominems.

    We can argue how to read the temp. map if you wish, but it's not that important since we are only arguing degree, not kind, pun intended.
    Reply