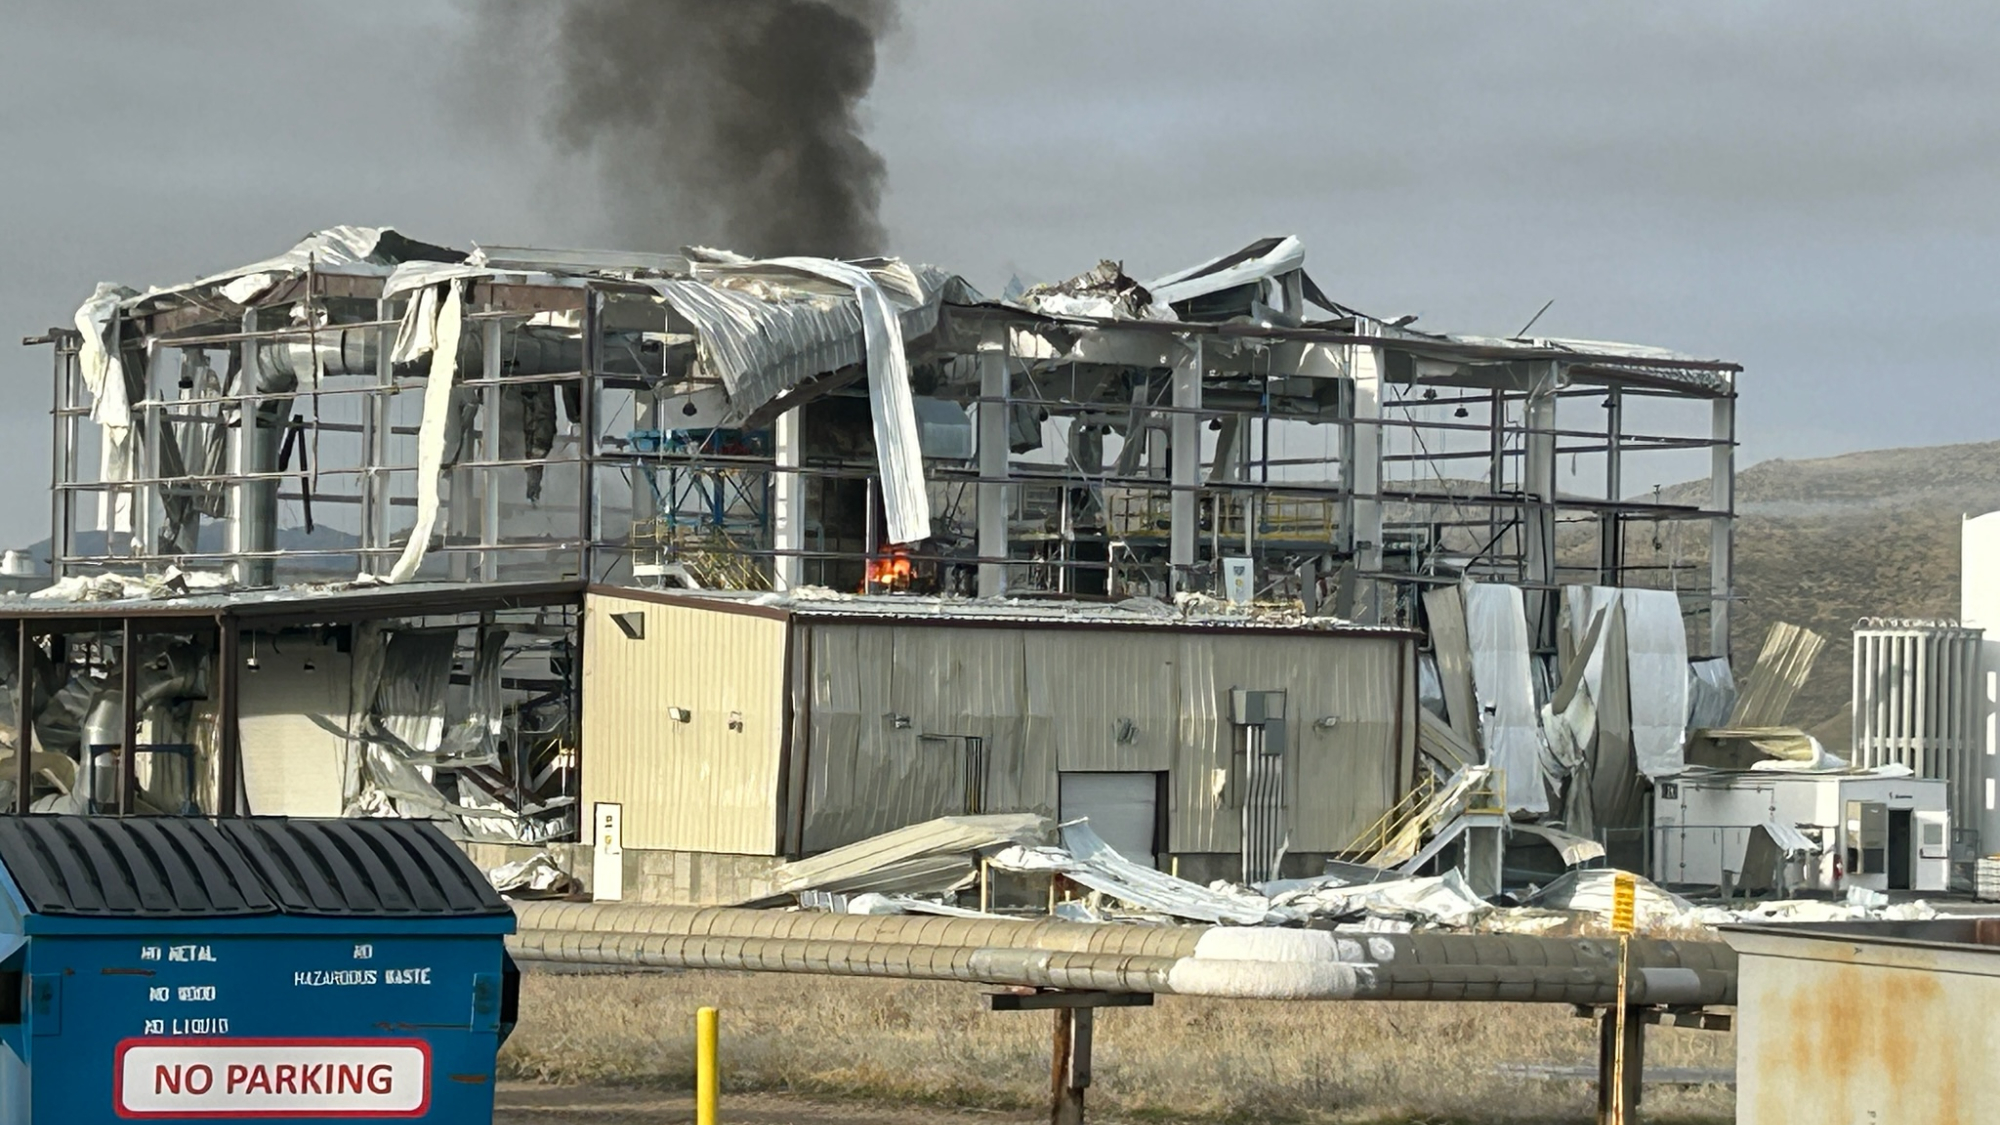
Philadelphia Refinery Explosion Shoots Fireball Visible from Space
This morning, one of our forecasters noticed that the refinery explosion in #Philadelphia was captured on satellite. The heat signature is so large and hot it could be detected using infrared imagery. pic.twitter.com/2zTcSM8n5UJune 21, 2019
A massive refinery explosion in Philadelphia was so hot and expansive that it was visible on weather satellites, according to the National Weather Service. The hot blob seen by the satellite was the fireball launched from the explosive disaster.
A forecaster at the National Weather Service (NWS) Key West office noticed the signature of the explosion on infrared imagery from a weather satellite, the office tweeted today. Infrared imagery captures heat, so the small burst of red and black in the satellite's view represents the heat of the explosion.
According to CNBC, there were five minor injuries in the explosion, which sent a towering fireball through the Philadelphia Energy Solutions refinery at 4:22 a.m. local time Friday (June 21). According to the refinery's website, the plant processes 335,000 barrels (14 million gallons) of crude oil per day and is the East Coast's largest oil-refining complex. The fireball, according to CBS News, was preceded by a large blaze that caused at least three explosions as it burned through the plant. Company officials said they suspected that propane — produced as a byproduct when lengthy hydrocarbons in petroleum get broken down into gas or heating oil — fueled the fire.
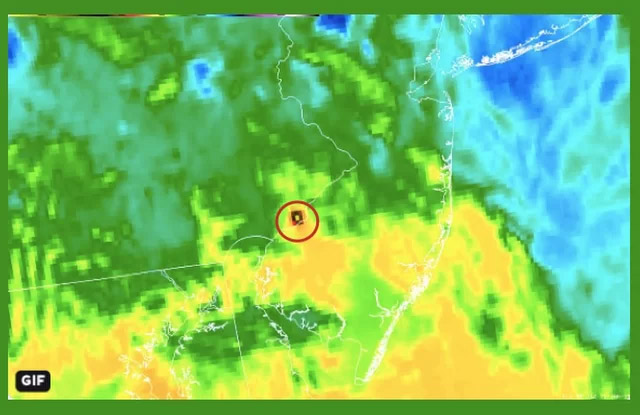
NWS meteorologist William Churchill of the Key West office also tweeted about the satellite view of the explosion from his personal account, noting that the data came from the Geostationary Operational Environmental Satellite (GOES) system. This system is operated by the National Oceanic and Atmospheric Administration (NOAA) and is used regularly in weather forecasting.
Satellite imagery often captures snapshots of explosive events. In March, NASA's Terra satellite captured a view of a meteor that exploded with the power of 173 kilotons of TNT over the Bering Sea. Infrared imagery can also capture bird's-eye views of volcanic activity, as in a 2017 shot made with Suomi NPP satellite data of a glowing Mount Etna in Italy. Infrared satellite instruments can also peer through obscuring smoke and haze to track the progression of wildfires, such as the deadly November 2018 Camp Fire in California.
- Images: Russian Meteor Explosion
- In Photos: Mysterious Radar Blob Puzzles Meteorologists
- Top 10 Greatest Explosions Ever
Originally published on Live Science.
Get the Space.com Newsletter
Breaking space news, the latest updates on rocket launches, skywatching events and more!
Join our Space Forums to keep talking space on the latest missions, night sky and more! And if you have a news tip, correction or comment, let us know at: community@space.com.

Stephanie Pappas is a contributing writer for Space.com sister site Live Science, covering topics ranging from geoscience to archaeology to the human brain and behavior. She was previously a senior writer for Live Science but is now a freelancer based in Denver, Colorado, and regularly contributes to Scientific American and The Monitor, the monthly magazine of the American Psychological Association. Stephanie received a bachelor's degree in psychology from the University of South Carolina and a graduate certificate in science communication from the University of California, Santa Cruz.

