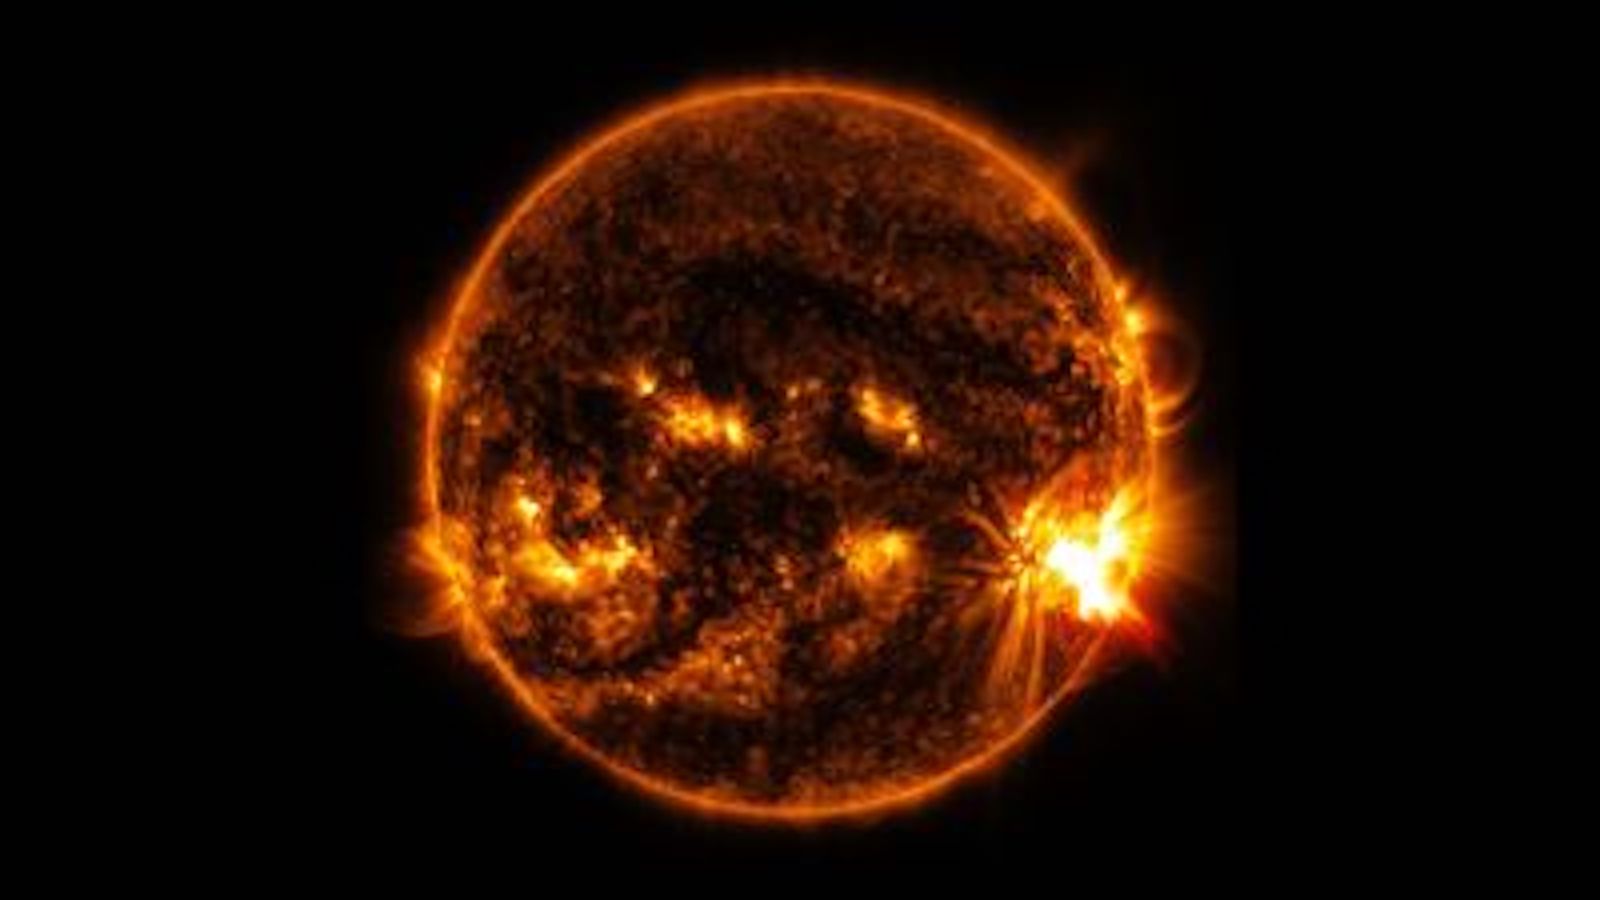
Tiny, bright flashes on the sun could help scientists predict solar flares

Our sun, a giant ball of plasma, is a magnetically messy place.
It hosts plasma layers in place of its solid surface, and each layer rotates at a different speed. The result is a tangled, turbulent magnetic field that sometimes wells to form sunspots on the sun's surface. These spots are visible indicators of imminent and sometimes intense eruptions from the sun's surface called solar flares. However, the hidden subtleties of the sun's behavior and that of its magnetic field that create and empower these spots have been poorly understood.
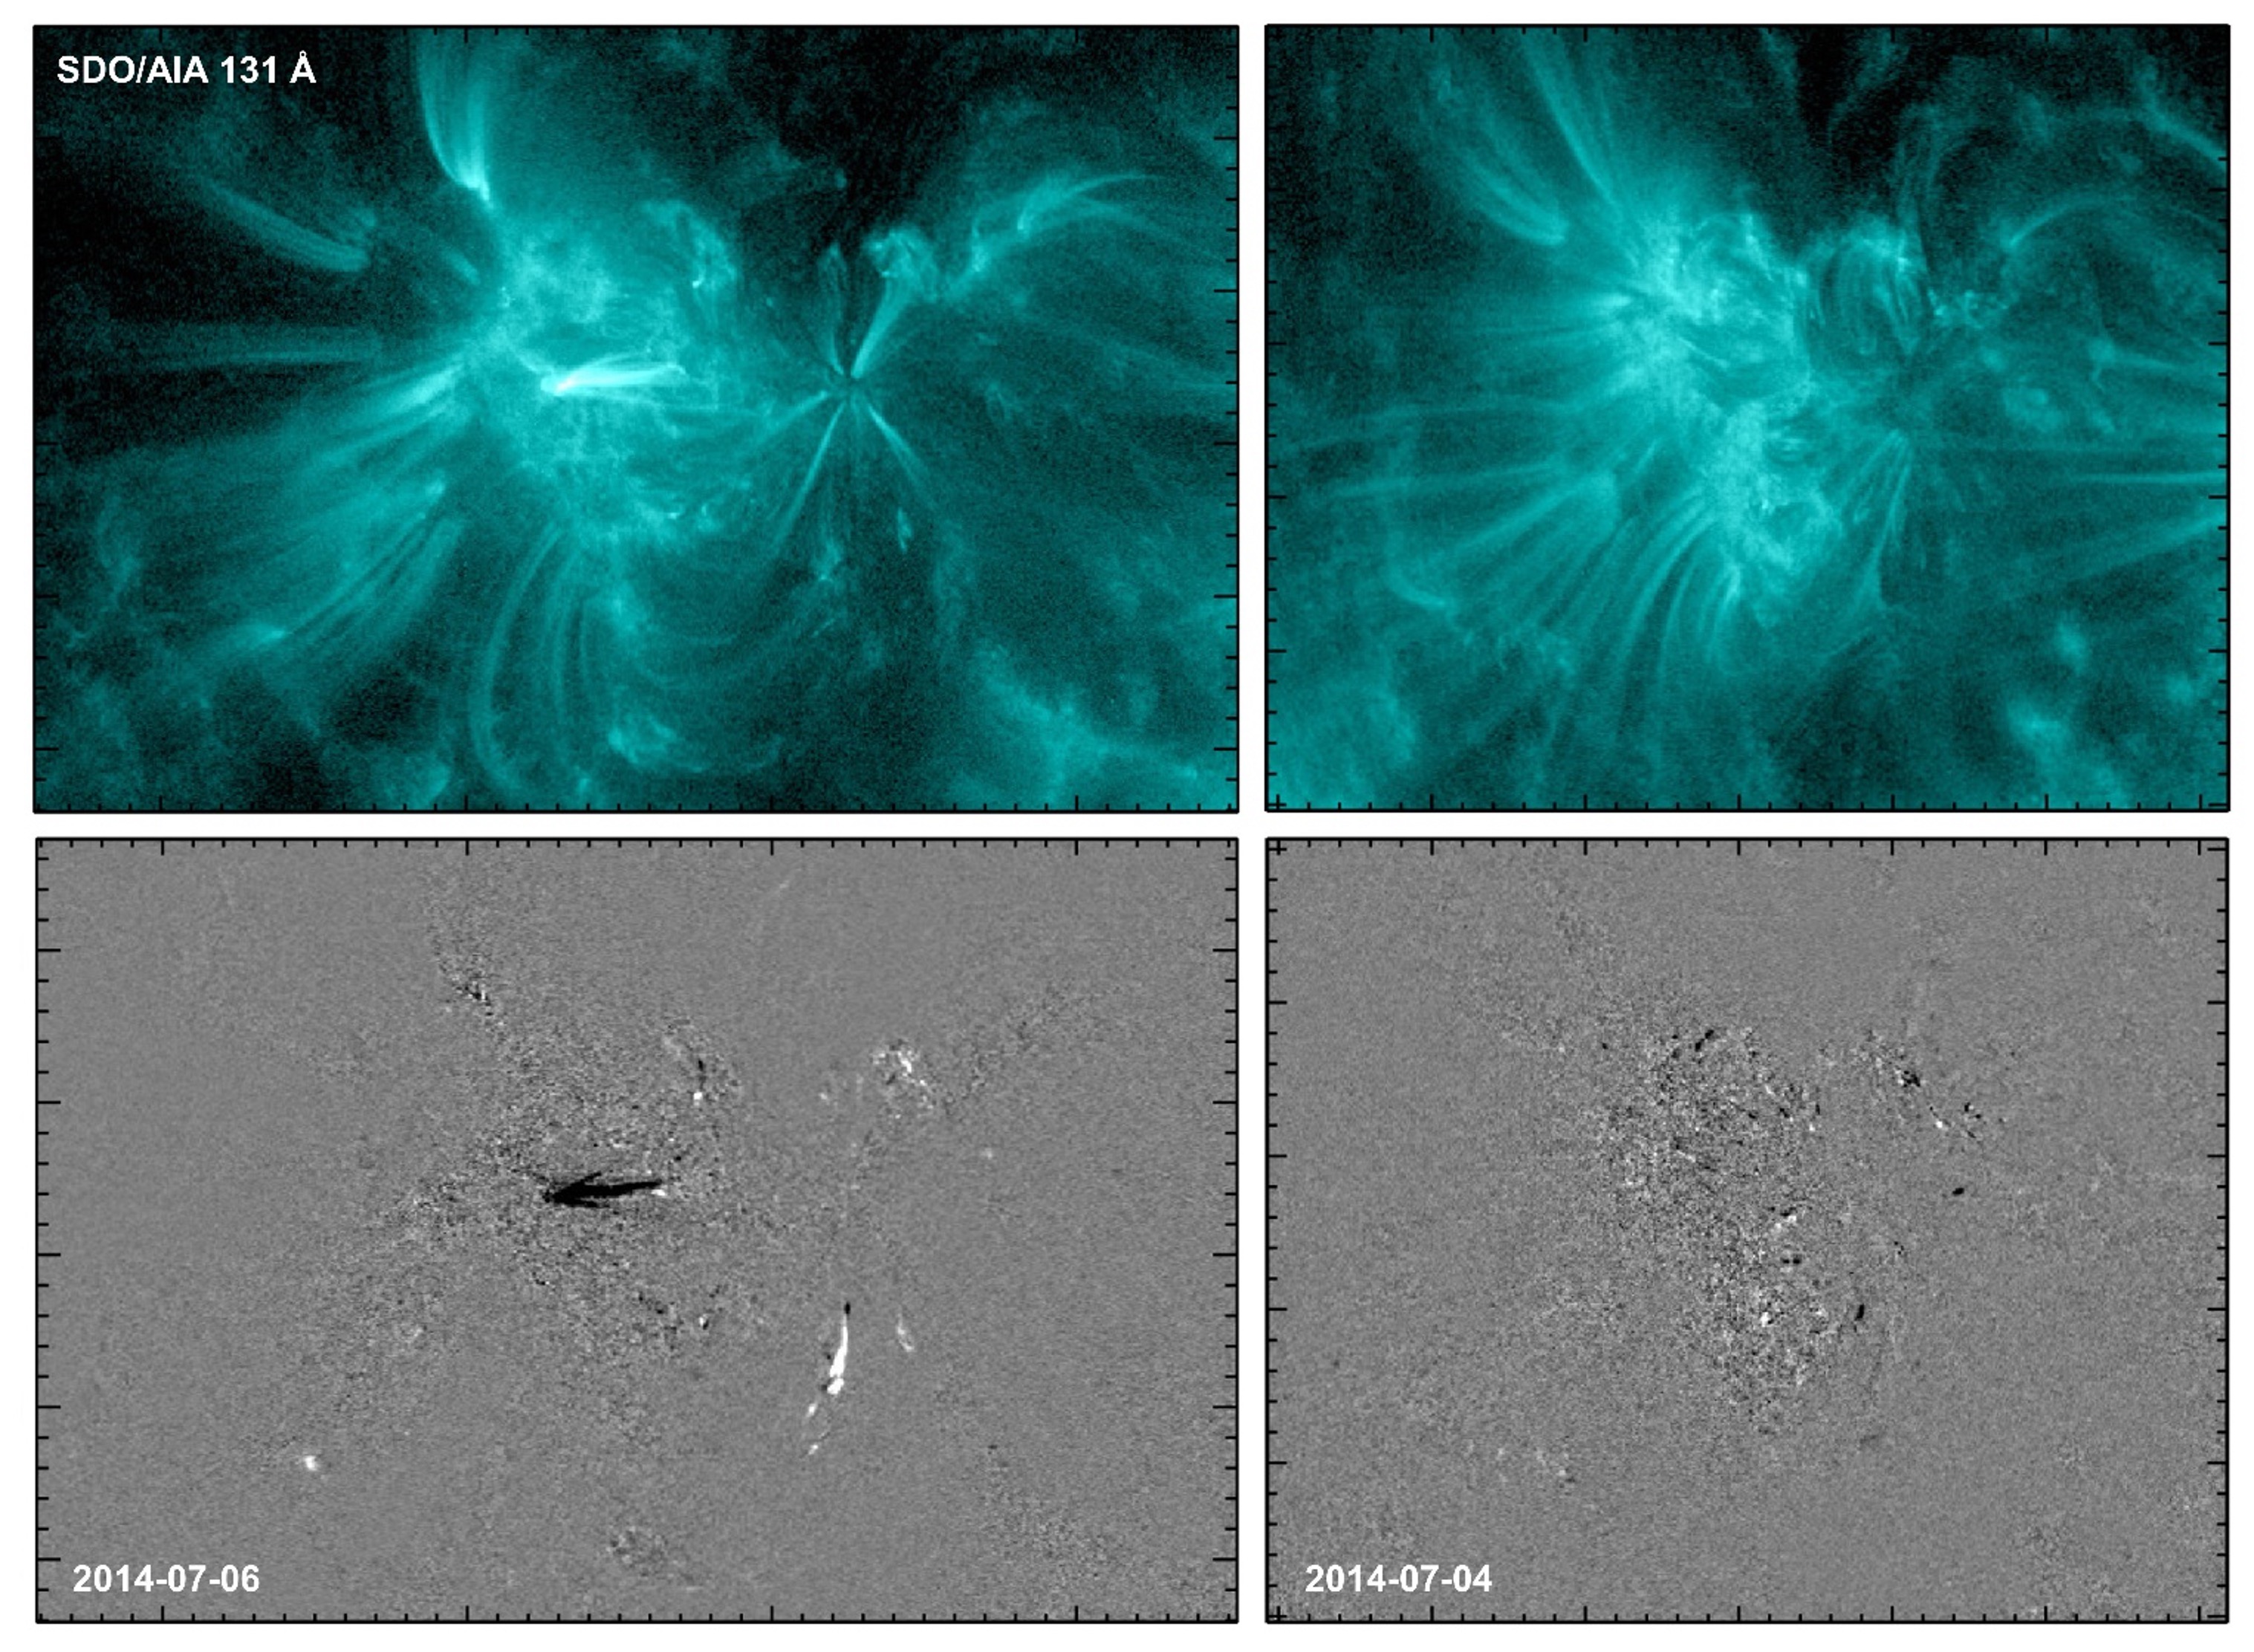
Now, two recently published papers show that tiny flashes occur in the sun's corona, or upper atmosphere, before flares are flung off of its surface. This knowledge would help astronomers understand the physics driving such magnetically-active regions.
Related: Sun unleashes barrage of 8 powerful solar flares (video)
Eventually, these short-lived but bright flashes could be a crucial cue for scientists looking to predict a range of solar flares, from mostly harmless minor ones to the strongest X-class flares that can cause blackouts on Earth and damage satellites.
"Our results may give us a new marker to distinguish which active regions are likely to flare soon and which will stay quiet over an upcoming period of time," KD Leka, an astronomer at NorthWest Research Associates in Boulder and an author of both studies, said in a NASA statement.
The search to find clues in the sun's behavior that would alert us to upcoming solar flares is not new. But in the past, astronomers focused on the magnetic field's behavior in the photosphere, which is the lowest layer of the sun's atmosphere and the innermost we can observe directly.
Get the Space.com Newsletter
Breaking space news, the latest updates on rocket launches, skywatching events and more!
In the latest research, Leka and her team focused on the upper layers of the solar atmosphere: the central chromosphere, the outer corona that's naturally visible only during a total solar eclipse and the transition region between the two layers.
"We can get some very different information in the corona than we get from the photosphere, or 'surface' of the sun," Leka said in the statement. Her team's goal was to find out what differentiates the active, flare-prone areas from dormant ones, and how easy it was to predict a flare knowing those differences.
To do so, they used large samples of data collected by NASA's Solar Dynamics Observatory, which provides information about the sun's magnetic field. The Atmospheric Imaging Assembly, an instrument onboard the SDO, is a watchful eye that photographs the sun in 10 wavelengths every 10 seconds, each picture at IMAX resolution, recording changes on the solar surface.

The instrument snapped pictures daily between June 2010 and December 2018, which made up a large chunk of solar cycle 24. (The sun's activity rises and falls in a cycle that usually lasts about 11 years.) The observations created a database of nine terabytes — a single terabyte being 1,000 gigabytes — that included close to 20 million images taken in ultraviolet and extreme ultraviolet wavelengths, which marked the appearance of active regions on the sun's surface and tracked their evolution into flares.
"It's the first time a database like this is readily available for the scientific community," co-author Karin Dissauer, an astrophysicist also at NorthWest Research Associates, said in the same statement. "It will be very useful for studying many topics, not just flare-ready active regions."
Scientists group solar flares into five classes based on the intensity of their X-rays: the most powerful are X-class flares, M-class are smaller but still major events, then C- and B-classes, with the smallest A-class solar flares too weak to impact Earth.
As one example, Leka's team focused on a weaker C-type flare that occurred on Aug. 3, 2011, and compared images taken over three and a half hours, showing the region's transition from quiet to flare-prone. The scientists found that the two images look fairly similar except for "a small localized brightening" that was the only easily identifiable difference that might herald an imminent flare.
Leka's team is focusing on part of the database that includes seven hours and 13 minutes of images taken daily in ultraviolet and extreme ultraviolet wavelengths, hoping to study both short-term changes and long-term trends for each active region in the database.
"With this research, we are really starting to dig deeper," Dissauer said in the statement. "Down the road, combining all this information from the surface up through the corona should allow forecasters to make better predictions about when and where solar flares will happen."
The research is described in two papers published Monday (Jan. 16) in The Astrophysical Journal.
Follow Sharmila Kuthunur on Twitter @Sharmilakg. Follow us on Twitter @Spacedotcom and on Facebook.
Join our Space Forums to keep talking space on the latest missions, night sky and more! And if you have a news tip, correction or comment, let us know at: community@space.com.

Sharmila Kuthunur is a Seattle-based science journalist focusing on astronomy and space exploration. Her work has also appeared in Scientific American, Astronomy and Live Science, among other publications. She has earned a master's degree in journalism from Northeastern University in Boston. Follow her on BlueSky @skuthunur.bsky.social
-
Helio Odd that it’s taken this long to see this likely important correlation. I didn’t easily find if flare strengths also correlated.Reply -
billslugg Possible reasons they didn't see this before:Reply
1) Predominately at a particular wavelength
2) Short lived
3) Small scale
From the abstract of the article:
"The 94 Å filter data provide the most parameters with discriminating power, with indications that it benefits from sampling multiple physical regimes. In particular, classification success using higher-order moments of running-difference images indicate a propensity for flare-imminent regions to display short-lived small-scale brightening events. "
Previously known relations to flare strength:
1)Total emission performs well
2) Steeply increasing/decreasing brightness performs well
3) Active region size performs well
4) Mean brightness does not perform well
"Total emission can perform notably, as can steeply increasing or decreasing brightness, although mean brightness measures do not, demonstrating the well-known active-region size/flare productivity relation."
Properties of Flare-imminent versus Flare-quiet Active Regions from the Chromosphere through the Corona. II. Nonparametric Discriminant Analysis Results from the NWRA Classification Infrastructure (NCI) - IOPscience -
Helio I ask because this seems like it could be another area amateurs could data mine (visually) to help warn of flares.Reply -
billslugg The teltale wavelength of 94 Angstroms is in the extreme UV/soft Xray area. Earth's atmosphere is not transparent at that wavelength.Reply -
Helio Reply
Right, that's why I mentioned the idea of a "data mine" effort as these images should be available from SDO.billslugg said:The teltale wavelength of 94 Angstroms is in the extreme UV/soft Xray area. Earth's atmosphere is not transparent at that wavelength.


